
|
Biocryst Pharmaceuticals ، Inc. (BCRX) DCF تقييم |
Fully Editable: Tailor To Your Needs In Excel Or Sheets
Professional Design: Trusted, Industry-Standard Templates
Investor-Approved Valuation Models
MAC/PC Compatible, Fully Unlocked
No Expertise Is Needed; Easy To Follow
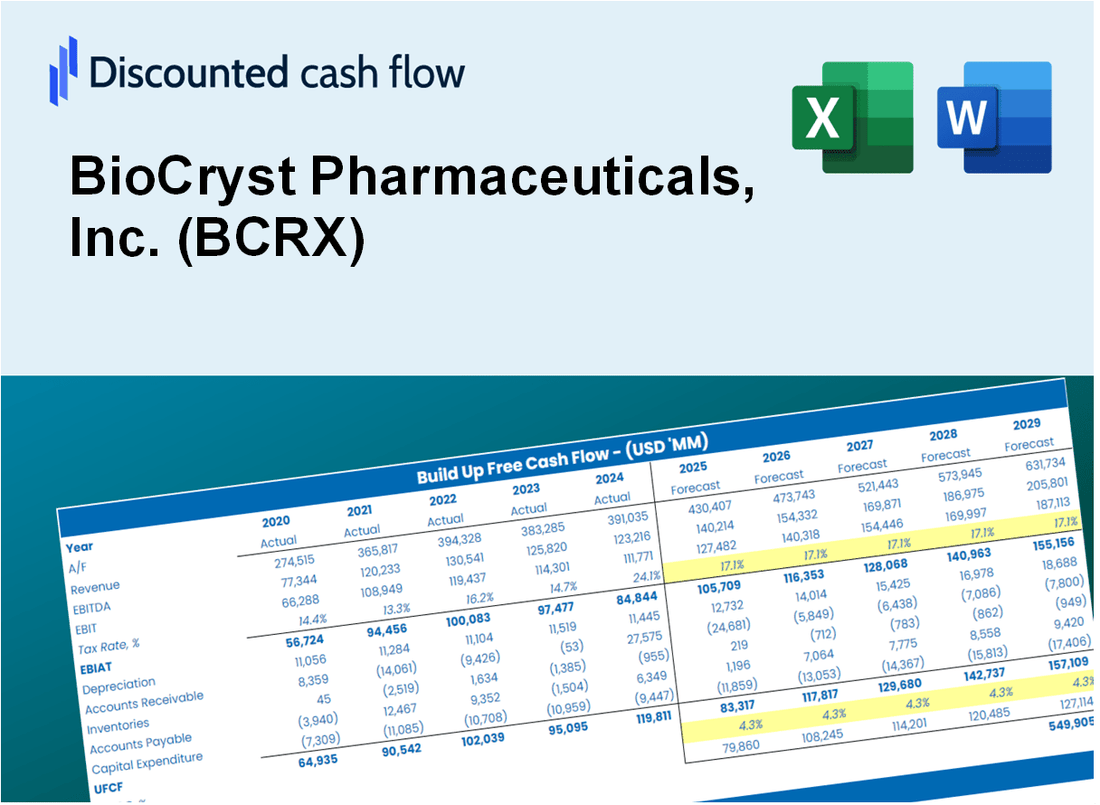
BioCryst Pharmaceuticals, Inc. (BCRX) Bundle
اكتسب نظرة ثاقبة على شركة BioCryst Pharmaceuticals، Inc. تحليل التقييم (BCRX) باستخدام حاسبة DCF المتطورة! قالب Excel هذا، المحمّل مسبقًا ببيانات حقيقية (BCRX)، يمكّنك من ضبط التوقعات والافتراضات لتحديد القيمة الجوهرية لـ BioCryst بدقة.
Discounted Cash Flow (DCF) - (USD MM)
| Year | AY1 2020 |
AY2 2021 |
AY3 2022 |
AY4 2023 |
AY5 2024 |
FY1 2025 |
FY2 2026 |
FY3 2027 |
FY4 2028 |
FY5 2029 |
|---|---|---|---|---|---|---|---|---|---|---|
| Revenue | 17.8 | 157.2 | 270.8 | 331.4 | 450.7 | 710.6 | 1,120.5 | 1,766.7 | 2,785.5 | 4,391.9 |
| Revenue Growth, % | 0 | 782.38 | 72.31 | 22.37 | 36 | 57.67 | 57.67 | 57.67 | 57.67 | 57.67 |
| EBITDA | -167.6 | -121.7 | -143.9 | -116.3 | 12.8 | -373.6 | -589.0 | -928.7 | -1,464.2 | -2,308.7 |
| EBITDA, % | -940.74 | -77.46 | -53.12 | -35.1 | 2.84 | -52.57 | -52.57 | -52.57 | -52.57 | -52.57 |
| Depreciation | .7 | .8 | 1.4 | 1.7 | 1.2 | 8.5 | 13.4 | 21.2 | 33.4 | 52.7 |
| Depreciation, % | 4.2 | 0.49437 | 0.5306 | 0.49938 | 0.27645 | 1.2 | 1.2 | 1.2 | 1.2 | 1.2 |
| EBIT | -168.3 | -122.5 | -145.3 | -118.0 | 11.6 | -376.1 | -593.0 | -935.0 | -1,474.3 | -2,324.5 |
| EBIT, % | -944.94 | -77.95 | -53.65 | -35.6 | 2.57 | -52.93 | -52.93 | -52.93 | -52.93 | -52.93 |
| Total Cash | 300.4 | 507.6 | 424.3 | 389.0 | 321.1 | 669.8 | 1,056.0 | 1,665.0 | 2,625.2 | 4,139.2 |
| Total Cash, percent | .0 | .0 | .0 | .0 | .0 | .0 | .0 | .0 | .0 | .0 |
| Account Receivables | 8.6 | 29.4 | 50.6 | 57.0 | 79.1 | 171.5 | 270.4 | 426.3 | 672.2 | 1,059.9 |
| Account Receivables, % | 48.54 | 18.71 | 18.68 | 17.18 | 17.54 | 24.13 | 24.13 | 24.13 | 24.13 | 24.13 |
| Inventories | 7.0 | 15.8 | 27.5 | 28.7 | 8.1 | 99.7 | 157.3 | 248.0 | 391.0 | 616.5 |
| Inventories, % | 39.52 | 10.05 | 10.17 | 8.65 | 1.79 | 14.04 | 14.04 | 14.04 | 14.04 | 14.04 |
| Accounts Payable | 18.7 | 27.8 | 14.4 | 20.9 | 11.6 | 187.4 | 295.5 | 466.0 | 734.7 | 1,158.4 |
| Accounts Payable, % | 105.06 | 17.69 | 5.3 | 6.3 | 2.58 | 26.38 | 26.38 | 26.38 | 26.38 | 26.38 |
| Capital Expenditure | -.5 | -2.4 | -1.4 | -2.2 | -1.1 | -8.3 | -13.0 | -20.5 | -32.3 | -51.0 |
| Capital Expenditure, % | -2.89 | -1.52 | -0.49884 | -0.65417 | -0.24938 | -1.16 | -1.16 | -1.16 | -1.16 | -1.16 |
| Tax Rate, % | -2.22 | -2.22 | -2.22 | -2.22 | -2.22 | -2.22 | -2.22 | -2.22 | -2.22 | -2.22 |
| EBITAT | -168.3 | -124.0 | -146.9 | -118.2 | 11.8 | -376.1 | -593.0 | -935.0 | -1,474.3 | -2,324.5 |
| Depreciation | ||||||||||
| Changes in Account Receivables | ||||||||||
| Changes in Inventories | ||||||||||
| Changes in Accounts Payable | ||||||||||
| Capital Expenditure | ||||||||||
| UFCF | -165.1 | -146.1 | -193.2 | -119.6 | 1.2 | -384.1 | -640.9 | -1,010.6 | -1,593.3 | -2,512.2 |
| WACC, % | 9.36 | 9.36 | 9.36 | 9.36 | 9.36 | 9.36 | 9.36 | 9.36 | 9.36 | 9.36 |
| PV UFCF | ||||||||||
| SUM PV UFCF | -4,380.6 | |||||||||
| Long Term Growth Rate, % | 2.00 | |||||||||
| Free cash flow (T + 1) | -2,562 | |||||||||
| Terminal Value | -34,839 | |||||||||
| Present Terminal Value | -22,278 | |||||||||
| Enterprise Value | -26,658 | |||||||||
| Net Debt | 736 | |||||||||
| Equity Value | -27,395 | |||||||||
| Diluted Shares Outstanding, MM | 207 | |||||||||
| Equity Value Per Share | -132.54 |
What You Will Get
- Real BCRX Financials: Access to both historical and projected data for precise valuation.
- Customizable Inputs: Adjust WACC, tax rates, revenue growth, and capital expenditures as needed.
- Dynamic Calculations: Intrinsic value and NPV are computed in real-time.
- Scenario Analysis: Evaluate various scenarios to assess BioCryst's future performance.
- User-Friendly Design: Designed for industry professionals while remaining approachable for newcomers.
Key Features
- 🔍 Real-Life BCRX Financials: Pre-filled historical and projected data for BioCryst Pharmaceuticals, Inc.
- ✏️ Fully Customizable Inputs: Adjust all critical parameters (yellow cells) like WACC, growth %, and tax rates.
- 📊 Professional DCF Valuation: Built-in formulas calculate BioCryst’s intrinsic value using the Discounted Cash Flow method.
- ⚡ Instant Results: Visualize BioCryst’s valuation instantly after making changes.
- Scenario Analysis: Test and compare outcomes for various financial assumptions side-by-side.
How It Works
- Step 1: Download the Excel file for BioCryst Pharmaceuticals, Inc. (BCRX).
- Step 2: Review the pre-entered data for BioCryst (historical and projected).
- Step 3: Adjust key assumptions (highlighted in yellow) based on your analysis.
- Step 4: Observe the automatic recalculations for BioCryst's intrinsic value.
- Step 5: Utilize the outputs for your investment decisions or reporting needs.
Why Choose BioCryst Pharmaceuticals, Inc. (BCRX)?
- Innovative Solutions: Pioneering treatments that address unmet medical needs in rare diseases.
- Proven Expertise: A team of seasoned professionals dedicated to advancing pharmaceutical science.
- Commitment to Quality: Rigorous testing and development processes ensure high standards in our products.
- Patient-Centric Approach: Focused on improving patient outcomes and enhancing quality of life.
- Strong Pipeline: A robust portfolio of drug candidates that promise future growth and value.
Who Should Use BioCryst Pharmaceuticals, Inc. (BCRX)?
- Pharmaceutical Students: Understand drug development processes and apply them to real-world case studies.
- Researchers: Utilize innovative models in your studies related to rare diseases and treatments.
- Investors: Evaluate your investment strategies and analyze the market potential of BioCryst's pipeline.
- Healthcare Analysts: Enhance your analysis with a tailored approach to assessing biotech companies.
- Medical Professionals: Learn how pharmaceutical companies like BioCryst are shaping the future of treatments.
What the Template Contains
- Pre-Filled Data: Includes BioCryst Pharmaceuticals’ historical financials and forecasts.
- Discounted Cash Flow Model: Editable DCF valuation model with automatic calculations.
- Weighted Average Cost of Capital (WACC): A dedicated sheet for calculating WACC based on custom inputs.
- Key Financial Ratios: Analyze BioCryst Pharmaceuticals’ profitability, efficiency, and leverage.
- Customizable Inputs: Edit revenue growth, margins, and tax rates with ease.
- Clear Dashboard: Charts and tables summarizing key valuation results.
Disclaimer
All information, articles, and product details provided on this website are for general informational and educational purposes only. We do not claim any ownership over, nor do we intend to infringe upon, any trademarks, copyrights, logos, brand names, or other intellectual property mentioned or depicted on this site. Such intellectual property remains the property of its respective owners, and any references here are made solely for identification or informational purposes, without implying any affiliation, endorsement, or partnership.
We make no representations or warranties, express or implied, regarding the accuracy, completeness, or suitability of any content or products presented. Nothing on this website should be construed as legal, tax, investment, financial, medical, or other professional advice. In addition, no part of this site—including articles or product references—constitutes a solicitation, recommendation, endorsement, advertisement, or offer to buy or sell any securities, franchises, or other financial instruments, particularly in jurisdictions where such activity would be unlawful.
All content is of a general nature and may not address the specific circumstances of any individual or entity. It is not a substitute for professional advice or services. Any actions you take based on the information provided here are strictly at your own risk. You accept full responsibility for any decisions or outcomes arising from your use of this website and agree to release us from any liability in connection with your use of, or reliance upon, the content or products found herein.