
|
شركة بلوم إنيرج كوربوريشن (BE) DCF تقييم |
Fully Editable: Tailor To Your Needs In Excel Or Sheets
Professional Design: Trusted, Industry-Standard Templates
Investor-Approved Valuation Models
MAC/PC Compatible, Fully Unlocked
No Expertise Is Needed; Easy To Follow
Bloom Energy Corporation (BE) Bundle
هل تبحث عن تقييم القيمة الجوهرية لشركة Bloom Energy Corporation ؟ تدمج حاسبة DCF (BE) الخاصة بنا بيانات العالم الحقيقي مع ميزات تخصيص واسعة النطاق، مما يسمح لك بتحسين توقعاتك وتعزيز خيارات الاستثمار الخاصة بك.
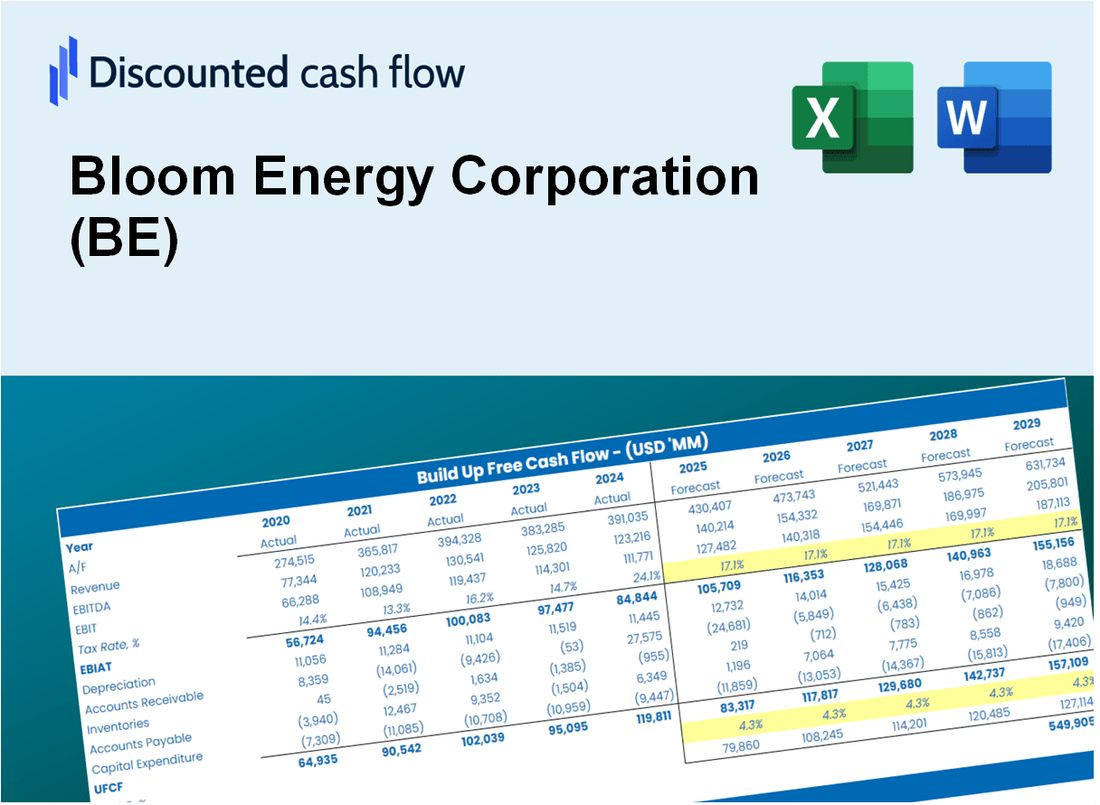
Discounted Cash Flow (DCF) - (USD MM)
| Year | AY1 2020 |
AY2 2021 |
AY3 2022 |
AY4 2023 |
AY5 2024 |
FY1 2025 |
FY2 2026 |
FY3 2027 |
FY4 2028 |
FY5 2029 |
|---|---|---|---|---|---|---|---|---|---|---|
| Revenue | 794.2 | 972.2 | 1,199.1 | 1,333.5 | 1,473.9 | 1,722.5 | 2,013.1 | 2,352.7 | 2,749.5 | 3,213.4 |
| Revenue Growth, % | 0 | 22.4 | 23.34 | 11.2 | 10.53 | 16.87 | 16.87 | 16.87 | 16.87 | 16.87 |
| EBITDA | -42.4 | -60.1 | -198.9 | -135.1 | 89.3 | -110.9 | -129.6 | -151.5 | -177.0 | -206.9 |
| EBITDA, % | -5.34 | -6.19 | -16.59 | -10.13 | 6.06 | -6.44 | -6.44 | -6.44 | -6.44 | -6.44 |
| Depreciation | 57.6 | 63.2 | 61.6 | 62.6 | 53.0 | 93.6 | 109.4 | 127.9 | 149.5 | 174.7 |
| Depreciation, % | 7.25 | 6.5 | 5.14 | 4.7 | 3.6 | 5.44 | 5.44 | 5.44 | 5.44 | 5.44 |
| EBIT | -100.0 | -123.3 | -260.5 | -197.7 | 36.3 | -204.5 | -239.0 | -279.4 | -326.5 | -381.6 |
| EBIT, % | -12.6 | -12.68 | -21.72 | -14.83 | 2.46 | -11.87 | -11.87 | -11.87 | -11.87 | -11.87 |
| Total Cash | 246.9 | 396.0 | 348.5 | 664.6 | 802.9 | 706.9 | 826.2 | 965.5 | 1,128.4 | 1,318.8 |
| Total Cash, percent | .0 | .0 | .0 | .0 | .0 | .0 | .0 | .0 | .0 | .0 |
| Account Receivables | 104.9 | 118.8 | 297.7 | 382.1 | 481.0 | 384.3 | 449.1 | 524.9 | 613.4 | 716.9 |
| Account Receivables, % | 13.21 | 12.22 | 24.83 | 28.66 | 32.64 | 22.31 | 22.31 | 22.31 | 22.31 | 22.31 |
| Inventories | 142.1 | 143.4 | 268.4 | 502.5 | 544.7 | 446.7 | 522.0 | 610.1 | 713.0 | 833.3 |
| Inventories, % | 17.89 | 14.75 | 22.38 | 37.68 | 36.95 | 25.93 | 25.93 | 25.93 | 25.93 | 25.93 |
| Accounts Payable | 58.3 | 73.0 | 161.8 | 132.1 | 92.7 | 153.4 | 179.3 | 209.6 | 244.9 | 286.2 |
| Accounts Payable, % | 7.34 | 7.51 | 13.49 | 9.9 | 6.29 | 8.91 | 8.91 | 8.91 | 8.91 | 8.91 |
| Capital Expenditure | -37.9 | -49.8 | -116.8 | -83.7 | -58.9 | -103.0 | -120.4 | -140.7 | -164.5 | -192.2 |
| Capital Expenditure, % | -4.77 | -5.12 | -9.74 | -6.28 | -3.99 | -5.98 | -5.98 | -5.98 | -5.98 | -5.98 |
| Tax Rate, % | -10.89 | -10.89 | -10.89 | -10.89 | -10.89 | -10.89 | -10.89 | -10.89 | -10.89 | -10.89 |
| EBITAT | -88.1 | -105.4 | -250.1 | -195.2 | 40.2 | -191.6 | -223.9 | -261.7 | -305.8 | -357.4 |
| Depreciation | ||||||||||
| Changes in Account Receivables | ||||||||||
| Changes in Inventories | ||||||||||
| Changes in Accounts Payable | ||||||||||
| Capital Expenditure | ||||||||||
| UFCF | -257.1 | -92.6 | -520.4 | -564.5 | -146.0 | 54.5 | -349.2 | -408.1 | -476.9 | -557.4 |
| WACC, % | 17.02 | 17.02 | 17.04 | 17.05 | 17.05 | 17.04 | 17.04 | 17.04 | 17.04 | 17.04 |
| PV UFCF | ||||||||||
| SUM PV UFCF | -971.0 | |||||||||
| Long Term Growth Rate, % | 2.00 | |||||||||
| Free cash flow (T + 1) | -569 | |||||||||
| Terminal Value | -3,781 | |||||||||
| Present Terminal Value | -1,722 | |||||||||
| Enterprise Value | -2,693 | |||||||||
| Net Debt | 727 | |||||||||
| Equity Value | -3,420 | |||||||||
| Diluted Shares Outstanding, MM | 227 | |||||||||
| Equity Value Per Share | -15.04 |
What You Will Receive
- Pre-Filled Financial Model: Bloom Energy Corporation’s (BE) actual data facilitates accurate DCF valuation.
- Comprehensive Forecast Control: Modify revenue growth, profit margins, WACC, and other essential drivers.
- Real-Time Calculations: Automatic updates allow you to view results instantly as changes are made.
- Investor-Ready Template: A polished Excel file crafted for high-quality valuation presentations.
- Customizable and Reusable: Designed for adaptability, enabling repeated use for in-depth forecasts.
Key Features
- Real-Life BE Data: Pre-filled with Bloom Energy's historical financials and forward-looking projections.
- Fully Customizable Inputs: Adjust revenue growth, margins, WACC, tax rates, and capital expenditures.
- Dynamic Valuation Model: Automatic updates to Net Present Value (NPV) and intrinsic value based on your inputs.
- Scenario Testing: Create multiple forecast scenarios to analyze different valuation outcomes.
- User-Friendly Design: Simple, structured, and designed for professionals and beginners alike.
How It Works
- Step 1: Download the Excel file.
- Step 2: Review pre-entered Bloom Energy Corporation (BE) data (historical and projected).
- Step 3: Adjust key assumptions (yellow cells) based on your analysis.
- Step 4: View automatic recalculations for Bloom Energy Corporation (BE)’s intrinsic value.
- Step 5: Use the outputs for investment decisions or reporting.
Why Choose This Calculator for Bloom Energy Corporation (BE)?
- Comprehensive Tool: Offers DCF, WACC, and financial ratio analyses all in one convenient package.
- Customizable Inputs: Modify the yellow-highlighted cells to explore different financial scenarios.
- Detailed Insights: Automatically computes Bloom Energy's intrinsic value and Net Present Value.
- Preloaded Data: Historical and projected data provide reliable starting points for analysis.
- Professional Quality: Perfect for financial analysts, investors, and business consultants focusing on Bloom Energy Corporation (BE).
Who Should Use This Product?
- Investors: Evaluate Bloom Energy Corporation’s (BE) valuation before making investment decisions.
- CFOs and Financial Analysts: Enhance valuation methodologies and assess financial forecasts for Bloom Energy Corporation (BE).
- Startup Founders: Discover the valuation strategies employed by established companies like Bloom Energy Corporation (BE).
- Consultants: Create comprehensive valuation reports tailored for clients utilizing Bloom Energy Corporation (BE) data.
- Students and Educators: Utilize real-life examples from Bloom Energy Corporation (BE) to teach and practice valuation principles.
What the Template Contains
- Operating and Balance Sheet Data: Pre-filled Bloom Energy Corporation (BE) historical data and forecasts, including revenue, EBITDA, EBIT, and capital expenditures.
- WACC Calculation: A dedicated sheet for Weighted Average Cost of Capital (WACC), including parameters like Beta, risk-free rate, and share price.
- DCF Valuation (Unlevered and Levered): Editable Discounted Cash Flow models showing intrinsic value with detailed calculations.
- Financial Statements: Pre-loaded financial statements (annual and quarterly) to support analysis.
- Key Ratios: Includes profitability, leverage, and efficiency ratios for Bloom Energy Corporation (BE).
- Dashboard and Charts: Visual summary of valuation outputs and assumptions to analyze results easily.
Disclaimer
All information, articles, and product details provided on this website are for general informational and educational purposes only. We do not claim any ownership over, nor do we intend to infringe upon, any trademarks, copyrights, logos, brand names, or other intellectual property mentioned or depicted on this site. Such intellectual property remains the property of its respective owners, and any references here are made solely for identification or informational purposes, without implying any affiliation, endorsement, or partnership.
We make no representations or warranties, express or implied, regarding the accuracy, completeness, or suitability of any content or products presented. Nothing on this website should be construed as legal, tax, investment, financial, medical, or other professional advice. In addition, no part of this site—including articles or product references—constitutes a solicitation, recommendation, endorsement, advertisement, or offer to buy or sell any securities, franchises, or other financial instruments, particularly in jurisdictions where such activity would be unlawful.
All content is of a general nature and may not address the specific circumstances of any individual or entity. It is not a substitute for professional advice or services. Any actions you take based on the information provided here are strictly at your own risk. You accept full responsibility for any decisions or outcomes arising from your use of this website and agree to release us from any liability in connection with your use of, or reliance upon, the content or products found herein.