
|
Bright Scholar Education Holdings Limited (BADU) DCF تقييم |
Fully Editable: Tailor To Your Needs In Excel Or Sheets
Professional Design: Trusted, Industry-Standard Templates
Investor-Approved Valuation Models
MAC/PC Compatible, Fully Unlocked
No Expertise Is Needed; Easy To Follow
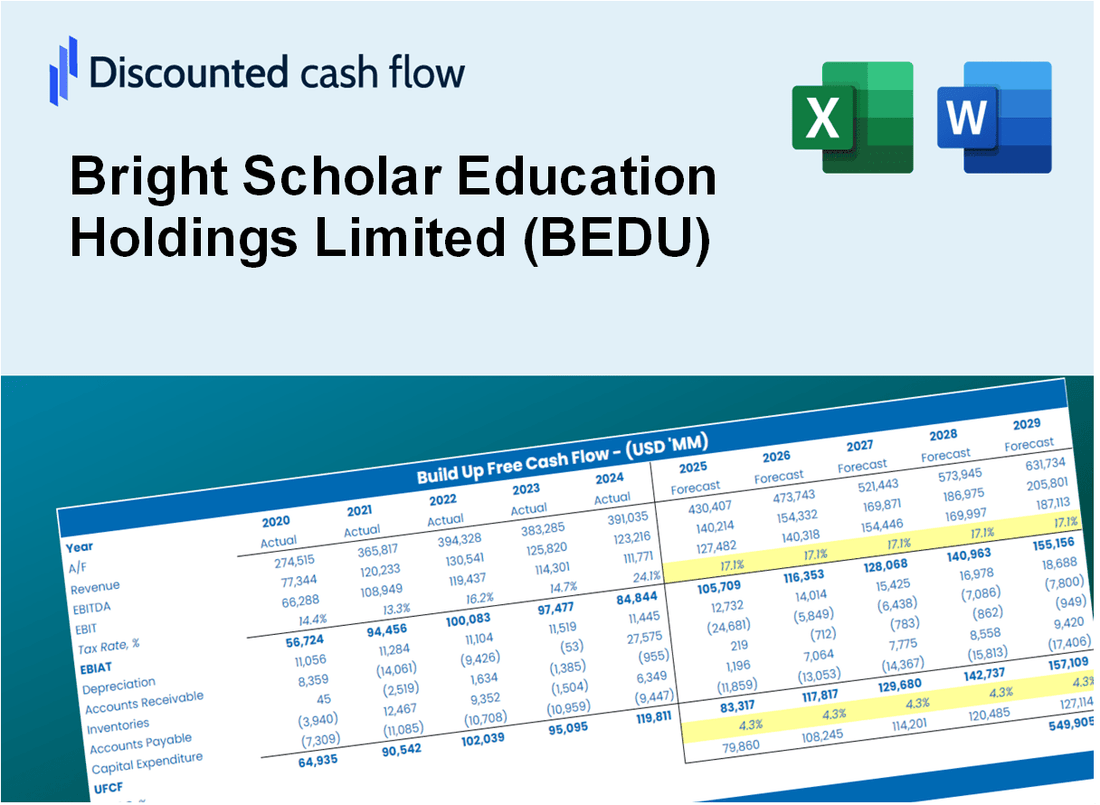
Bright Scholar Education Holdings Limited (BEDU) Bundle
استكشف النظرة المالية لـ Bright Scholar Education Holdings Limited (BADU) مع حاسبة DCF سهلة الاستخدام! أدخل توقعاتك للنمو والهوامش والمصروفات لحساب القيمة الجوهرية لـ Bright Scholar Education Holdings Limited (BADU) وصقل نهج الاستثمار الخاص بك.
Discounted Cash Flow (DCF) - (USD MM)
| Year | AY1 2020 |
AY2 2021 |
AY3 2022 |
AY4 2023 |
AY5 2024 |
FY1 2025 |
FY2 2026 |
FY3 2027 |
FY4 2028 |
FY5 2029 |
|---|---|---|---|---|---|---|---|---|---|---|
| Revenue | 473.2 | 197.0 | 202.3 | 298.5 | 246.7 | 231.0 | 216.3 | 202.5 | 189.6 | 177.5 |
| Revenue Growth, % | 0 | -58.36 | 2.68 | 47.56 | -17.35 | -6.37 | -6.37 | -6.37 | -6.37 | -6.37 |
| EBITDA | 8.4 | -11.6 | -50.8 | -15.4 | -107.4 | -36.0 | -33.7 | -31.5 | -29.5 | -27.6 |
| EBITDA, % | 1.78 | -5.88 | -25.09 | -5.15 | -43.52 | -15.57 | -15.57 | -15.57 | -15.57 | -15.57 |
| Depreciation | 27.8 | 31.2 | 16.3 | 11.8 | 8.9 | 17.2 | 16.1 | 15.1 | 14.1 | 13.2 |
| Depreciation, % | 5.86 | 15.82 | 8.05 | 3.95 | 3.59 | 7.46 | 7.46 | 7.46 | 7.46 | 7.46 |
| EBIT | -19.3 | -42.8 | -67.1 | -27.2 | -116.2 | -53.2 | -49.8 | -46.6 | -43.7 | -40.9 |
| EBIT, % | -4.09 | -21.7 | -33.14 | -9.1 | -47.12 | -23.03 | -23.03 | -23.03 | -23.03 | -23.03 |
| Total Cash | 476.7 | 118.7 | 95.1 | 59.8 | 69.4 | 118.0 | 110.5 | 103.4 | 96.9 | 90.7 |
| Total Cash, percent | .0 | .0 | .0 | .0 | .0 | .0 | .0 | .0 | .0 | .0 |
| Account Receivables | 11.8 | 33.1 | 3.8 | 2.7 | 2.6 | 10.7 | 10.0 | 9.4 | 8.8 | 8.2 |
| Account Receivables, % | 2.49 | 16.78 | 1.9 | 0.90448 | 1.07 | 4.63 | 4.63 | 4.63 | 4.63 | 4.63 |
| Inventories | 3.9 | 1.1 | 1.0 | .8 | .2 | 1.0 | .9 | .9 | .8 | .8 |
| Inventories, % | 0.83211 | 0.54067 | 0.47725 | 0.25803 | 0.06608911 | 0.43483 | 0.43483 | 0.43483 | 0.43483 | 0.43483 |
| Accounts Payable | 9.6 | 10.3 | 14.1 | 14.8 | 12.9 | 11.3 | 10.6 | 9.9 | 9.3 | 8.7 |
| Accounts Payable, % | 2.03 | 5.24 | 6.96 | 4.95 | 5.23 | 4.88 | 4.88 | 4.88 | 4.88 | 4.88 |
| Capital Expenditure | -21.1 | -22.3 | -12.6 | -11.2 | -6.4 | -13.1 | -12.3 | -11.5 | -10.7 | -10.1 |
| Capital Expenditure, % | -4.45 | -11.32 | -6.23 | -3.74 | -2.59 | -5.66 | -5.66 | -5.66 | -5.66 | -5.66 |
| Tax Rate, % | -19.15 | -19.15 | -19.15 | -19.15 | -19.15 | -19.15 | -19.15 | -19.15 | -19.15 | -19.15 |
| EBITAT | -12.8 | -5.1 | -75.3 | -62.0 | -138.5 | -40.2 | -37.7 | -35.3 | -33.0 | -30.9 |
| Depreciation | ||||||||||
| Changes in Account Receivables | ||||||||||
| Changes in Inventories | ||||||||||
| Changes in Accounts Payable | ||||||||||
| Capital Expenditure | ||||||||||
| UFCF | -12.2 | -14.0 | -38.5 | -59.4 | -137.2 | -46.6 | -33.8 | -31.6 | -29.6 | -27.7 |
| WACC, % | 2.52 | 0.53606 | 3.77 | 3.77 | 3.77 | 2.87 | 2.87 | 2.87 | 2.87 | 2.87 |
| PV UFCF | ||||||||||
| SUM PV UFCF | -156.7 | |||||||||
| Long Term Growth Rate, % | 2.00 | |||||||||
| Free cash flow (T + 1) | -28 | |||||||||
| Terminal Value | -3,248 | |||||||||
| Present Terminal Value | -2,819 | |||||||||
| Enterprise Value | -2,976 | |||||||||
| Net Debt | 143 | |||||||||
| Equity Value | -3,119 | |||||||||
| Diluted Shares Outstanding, MM | 2 | |||||||||
| Equity Value Per Share | -1,682.19 |
What You Will Get
- Editable Excel Template: A fully customizable Excel-based DCF Calculator featuring pre-filled real BEDU financials.
- Real-World Data: Historical data and forward-looking estimates (highlighted in the yellow cells).
- Forecast Flexibility: Modify forecast assumptions such as revenue growth, EBITDA %, and WACC.
- Automatic Calculations: Instantly observe the effect of your inputs on Bright Scholar’s valuation.
- Professional Tool: Designed for investors, CFOs, consultants, and financial analysts.
- User-Friendly Design: Organized for clarity and simplicity, complete with step-by-step instructions.
Key Features
- Comprehensive DCF Calculator: Features detailed unlevered and levered DCF valuation models tailored for Bright Scholar Education Holdings Limited (BEDU).
- WACC Calculator: Pre-designed Weighted Average Cost of Capital sheet with adjustable inputs for personalized analysis.
- Customizable Forecast Assumptions: Adjust growth rates, capital expenditures, and discount rates to fit your analysis.
- Integrated Financial Ratios: Evaluate profitability, leverage, and efficiency ratios specifically for Bright Scholar Education Holdings Limited (BEDU).
- Interactive Dashboard and Charts: Visual representations summarize essential valuation metrics for straightforward interpretation.
How It Works
- Step 1: Download the Excel file.
- Step 2: Review Bright Scholar Education Holdings Limited's (BEDU) pre-filled financial data and forecasts.
- Step 3: Modify key inputs such as enrollment growth, operating margins, and tax rates (highlighted cells).
- Step 4: Observe the DCF model update in real-time as you adjust your assumptions.
- Step 5: Evaluate the outputs and leverage the results for your investment strategies.
Why Choose This Calculator for Bright Scholar Education Holdings Limited (BEDU)?
- All-in-One Solution: Combines DCF, WACC, and financial ratio analyses tailored for BEDU.
- Flexible Parameters: Modify the yellow-highlighted cells to explore different scenarios for BEDU.
- In-Depth Analysis: Automatically computes Bright Scholar’s intrinsic value and Net Present Value.
- Preloaded Information: Historical and projected data provide reliable starting points for analysis.
- Expert-Level Quality: Perfect for financial analysts, investors, and educational consultants focusing on BEDU.
Who Should Use This Product?
- Investors: Evaluate Bright Scholar Education Holdings Limited’s (BEDU) valuation before making investment decisions.
- CFOs and Financial Analysts: Optimize valuation workflows and assess financial projections for BEDU.
- Startup Founders: Understand how educational companies like Bright Scholar are valued in the market.
- Consultants: Provide detailed valuation reports for clients focused on the education sector.
- Students and Educators: Utilize real-world examples from BEDU to learn and teach valuation methodologies.
What the Template Contains
- Preloaded BEDU Data: Historical and projected financial data, including revenue, EBIT, and capital expenditures.
- DCF and WACC Models: Professional-grade sheets for calculating intrinsic value and Weighted Average Cost of Capital.
- Editable Inputs: Yellow-highlighted cells for adjusting revenue growth, tax rates, and discount rates.
- Financial Statements: Comprehensive annual and quarterly financials for deeper analysis.
- Key Ratios: Profitability, leverage, and efficiency ratios to evaluate performance.
- Dashboard and Charts: Visual summaries of valuation outcomes and assumptions.
Disclaimer
All information, articles, and product details provided on this website are for general informational and educational purposes only. We do not claim any ownership over, nor do we intend to infringe upon, any trademarks, copyrights, logos, brand names, or other intellectual property mentioned or depicted on this site. Such intellectual property remains the property of its respective owners, and any references here are made solely for identification or informational purposes, without implying any affiliation, endorsement, or partnership.
We make no representations or warranties, express or implied, regarding the accuracy, completeness, or suitability of any content or products presented. Nothing on this website should be construed as legal, tax, investment, financial, medical, or other professional advice. In addition, no part of this site—including articles or product references—constitutes a solicitation, recommendation, endorsement, advertisement, or offer to buy or sell any securities, franchises, or other financial instruments, particularly in jurisdictions where such activity would be unlawful.
All content is of a general nature and may not address the specific circumstances of any individual or entity. It is not a substitute for professional advice or services. Any actions you take based on the information provided here are strictly at your own risk. You accept full responsibility for any decisions or outcomes arising from your use of this website and agree to release us from any liability in connection with your use of, or reliance upon, the content or products found herein.