
|
تقييم مجموعة بيركس (BGI) DCF |
Fully Editable: Tailor To Your Needs In Excel Or Sheets
Professional Design: Trusted, Industry-Standard Templates
Investor-Approved Valuation Models
MAC/PC Compatible, Fully Unlocked
No Expertise Is Needed; Easy To Follow
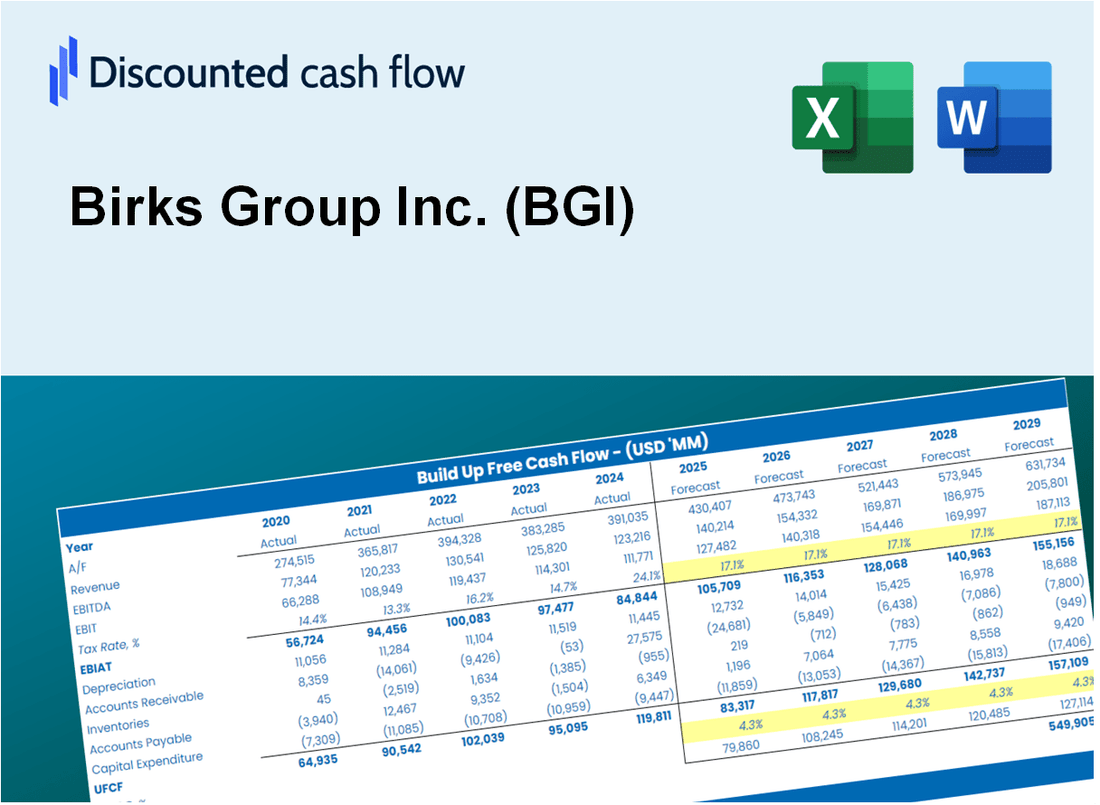
Birks Group Inc. (BGI) Bundle
تم تصميم حاسبة DCF (BGI) للدقة، وتمكنك من تقييم تقييم Birks Group Inc. باستخدام البيانات المالية الفعلية والمرونة الكاملة لتعديل جميع المعلمات الأساسية لتحسين التوقعات.
Discounted Cash Flow (DCF) - (USD MM)
| Year | AY1 2021 |
AY2 2022 |
AY3 2023 |
AY4 2024 |
AY5 2025 |
FY1 2026 |
FY2 2027 |
FY3 2028 |
FY4 2029 |
FY5 2030 |
|---|---|---|---|---|---|---|---|---|---|---|
| Revenue | 102.2 | 129.5 | 116.4 | 132.3 | 127.0 | 135.3 | 144.2 | 153.7 | 163.8 | 174.6 |
| Revenue Growth, % | 0 | 26.75 | -10.14 | 13.7 | -4.03 | 6.57 | 6.57 | 6.57 | 6.57 | 6.57 |
| EBITDA | 1.9 | 7.3 | 1.3 | 5.6 | 1.6 | 3.8 | 4.1 | 4.3 | 4.6 | 4.9 |
| EBITDA, % | 1.84 | 5.67 | 1.14 | 4.24 | 1.24 | 2.83 | 2.83 | 2.83 | 2.83 | 2.83 |
| Depreciation | 3.9 | 4.1 | 4.1 | 4.7 | 5.5 | 5.0 | 5.3 | 5.7 | 6.0 | 6.4 |
| Depreciation, % | 3.81 | 3.2 | 3.48 | 3.58 | 4.35 | 3.69 | 3.69 | 3.69 | 3.69 | 3.69 |
| EBIT | -2.0 | 3.2 | -2.7 | .9 | -4.0 | -1.2 | -1.2 | -1.3 | -1.4 | -1.5 |
| EBIT, % | -1.97 | 2.46 | -2.34 | 0.65362 | -3.11 | -0.86072 | -0.86072 | -0.86072 | -0.86072 | -0.86072 |
| Total Cash | 1.3 | 1.4 | .9 | 1.3 | 1.1 | 1.3 | 1.4 | 1.5 | 1.6 | 1.7 |
| Total Cash, percent | .0 | .0 | .0 | .0 | .0 | .0 | .0 | .0 | .0 | .0 |
| Account Receivables | 5.2 | 5.7 | 8.1 | 6.0 | 4.7 | 6.7 | 7.2 | 7.6 | 8.1 | 8.7 |
| Account Receivables, % | 5.11 | 4.43 | 6.98 | 4.56 | 3.72 | 4.96 | 4.96 | 4.96 | 4.96 | 4.96 |
| Inventories | 69.8 | 56.4 | 63.1 | 70.8 | 83.0 | 77.1 | 82.2 | 87.6 | 93.4 | 99.5 |
| Inventories, % | 68.35 | 43.51 | 54.22 | 53.47 | 65.4 | 56.99 | 56.99 | 56.99 | 56.99 | 56.99 |
| Accounts Payable | 27.1 | 20.2 | 26.9 | 30.7 | 41.5 | 32.8 | 34.9 | 37.2 | 39.7 | 42.3 |
| Accounts Payable, % | 26.54 | 15.6 | 23.1 | 23.21 | 32.68 | 24.23 | 24.23 | 24.23 | 24.23 | 24.23 |
| Capital Expenditure | -2.1 | -4.2 | -6.7 | -5.2 | -5.4 | -5.2 | -5.5 | -5.9 | -6.3 | -6.7 |
| Capital Expenditure, % | -2.09 | -3.2 | -5.78 | -3.91 | -4.25 | -3.84 | -3.84 | -3.84 | -3.84 | -3.84 |
| Tax Rate, % | 15.92 | 15.92 | 15.92 | 15.92 | 15.92 | 15.92 | 15.92 | 15.92 | 15.92 | 15.92 |
| EBITAT | -3.1 | -4.7 | -2.2 | .6 | -3.3 | -.8 | -.8 | -.9 | -.9 | -1.0 |
| Depreciation | ||||||||||
| Changes in Account Receivables | ||||||||||
| Changes in Inventories | ||||||||||
| Changes in Accounts Payable | ||||||||||
| Capital Expenditure | ||||||||||
| UFCF | -49.2 | 1.3 | -7.3 | -1.6 | -3.4 | -5.8 | -4.4 | -4.7 | -5.0 | -5.3 |
| WACC, % | 6.39 | 0.84142 | 5.23 | 4.62 | 5.5 | 4.52 | 4.52 | 4.52 | 4.52 | 4.52 |
| PV UFCF | ||||||||||
| SUM PV UFCF | -22.1 | |||||||||
| Long Term Growth Rate, % | 2.00 | |||||||||
| Free cash flow (T + 1) | -5 | |||||||||
| Terminal Value | -216 | |||||||||
| Present Terminal Value | -173 | |||||||||
| Enterprise Value | -195 | |||||||||
| Net Debt | 103 | |||||||||
| Equity Value | -298 | |||||||||
| Diluted Shares Outstanding, MM | 19 | |||||||||
| Equity Value Per Share | -15.51 |
What You Will Get
- Real BGI Financial Data: Pre-filled with Birks Group Inc.'s historical and projected data for precise analysis.
- Fully Editable Template: Modify key inputs like revenue growth, WACC, and EBITDA % with ease.
- Automatic Calculations: See Birks Group Inc.'s intrinsic value update instantly based on your changes.
- Professional Valuation Tool: Designed for investors, analysts, and consultants seeking accurate DCF results.
- User-Friendly Design: Simple structure and clear instructions for all experience levels.
Key Features
- Comprehensive Financial Data: Birks Group Inc.'s historical financial statements and pre-filled projections.
- Customizable Parameters: Modify WACC, tax rates, revenue growth, and EBITDA margins as needed.
- Real-Time Calculations: Watch Birks Group Inc.'s intrinsic value update instantly.
- Intuitive Visual Representations: Dashboard graphs showcase valuation outcomes and essential metrics.
- Designed for Precision: A reliable resource for analysts, investors, and finance professionals.
How It Works
- Download: Obtain the pre-prepared Excel file containing Birks Group Inc.'s (BGI) financial data.
- Customize: Modify projections, including revenue growth, EBITDA %, and WACC.
- Update Automatically: The intrinsic value and NPV calculations refresh in real-time.
- Test Scenarios: Generate various forecasts and compare results instantly.
- Make Decisions: Leverage the valuation insights to inform your investment strategy.
Why Choose This Calculator for Birks Group Inc. (BGI)?
- Accurate Data: Utilize real Birks Group financials for dependable valuation outcomes.
- Customizable: Modify essential parameters such as growth rates, WACC, and tax rates to align with your forecasts.
- Time-Saving: Built-in calculations streamline the process, eliminating the need to start from the ground up.
- Professional-Grade Tool: Tailored for investors, analysts, and consultants in the luxury goods sector.
- User-Friendly: Easy-to-navigate layout and clear instructions ensure accessibility for all users.
Who Should Use This Product?
- Professional Investors: Create comprehensive and accurate valuation models for investment analysis in Birks Group Inc. (BGI).
- Corporate Finance Teams: Evaluate valuation scenarios to inform strategic decisions within the organization.
- Consultants and Advisors: Deliver precise valuation insights to clients interested in Birks Group Inc. (BGI) stock.
- Students and Educators: Utilize real-world data to enhance learning and practice in financial modeling.
- Jewelry Industry Enthusiasts: Gain insights into how luxury brands like Birks Group Inc. (BGI) are valued in the marketplace.
What the Template Contains
- Pre-Filled Data: Contains Birks Group Inc.’s (BGI) historical financials and projections.
- Discounted Cash Flow Model: Editable DCF valuation model with real-time calculations.
- Weighted Average Cost of Capital (WACC): A dedicated sheet for WACC calculation based on user-defined inputs.
- Key Financial Ratios: Assess Birks Group Inc.’s (BGI) profitability, efficiency, and leverage metrics.
- Customizable Inputs: Easily modify revenue growth, profit margins, and tax rates.
- Clear Dashboard: Visual representations and tables summarizing essential valuation outcomes.
Disclaimer
All information, articles, and product details provided on this website are for general informational and educational purposes only. We do not claim any ownership over, nor do we intend to infringe upon, any trademarks, copyrights, logos, brand names, or other intellectual property mentioned or depicted on this site. Such intellectual property remains the property of its respective owners, and any references here are made solely for identification or informational purposes, without implying any affiliation, endorsement, or partnership.
We make no representations or warranties, express or implied, regarding the accuracy, completeness, or suitability of any content or products presented. Nothing on this website should be construed as legal, tax, investment, financial, medical, or other professional advice. In addition, no part of this site—including articles or product references—constitutes a solicitation, recommendation, endorsement, advertisement, or offer to buy or sell any securities, franchises, or other financial instruments, particularly in jurisdictions where such activity would be unlawful.
All content is of a general nature and may not address the specific circumstances of any individual or entity. It is not a substitute for professional advice or services. Any actions you take based on the information provided here are strictly at your own risk. You accept full responsibility for any decisions or outcomes arising from your use of this website and agree to release us from any liability in connection with your use of, or reliance upon, the content or products found herein.