
|
Benchmark Electronics ، Inc. (BHE) DCF تقييم |
Fully Editable: Tailor To Your Needs In Excel Or Sheets
Professional Design: Trusted, Industry-Standard Templates
Investor-Approved Valuation Models
MAC/PC Compatible, Fully Unlocked
No Expertise Is Needed; Easy To Follow
Benchmark Electronics, Inc. (BHE) Bundle
قم بتبسيط تحليلك وتحسين الدقة باستخدام حاسبة DCF [BHE]! مزودة ببيانات Benchmark Electronics الفعلية والافتراضات القابلة للتخصيص، تتيح لك هذه الأداة التنبؤ وتقييم وتقييم [الشركة] مثل المستثمر المخضرم.
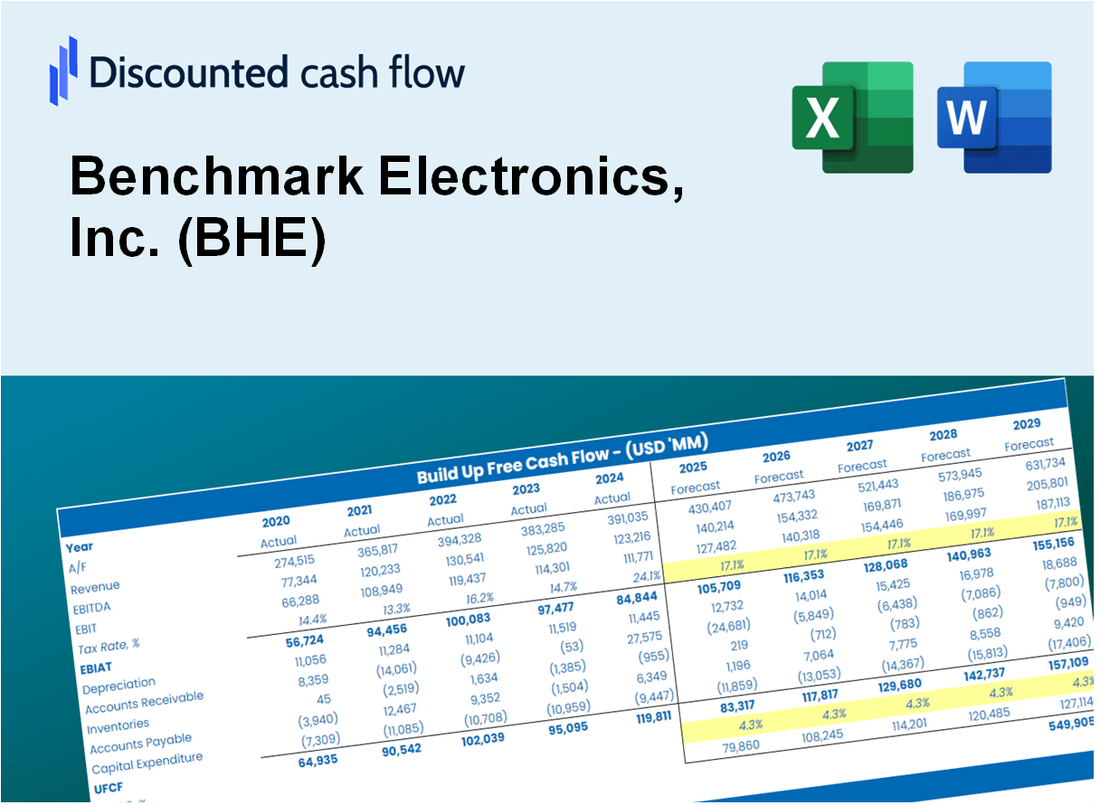
Discounted Cash Flow (DCF) - (USD MM)
| Year | AY1 2020 |
AY2 2021 |
AY3 2022 |
AY4 2023 |
AY5 2024 |
FY1 2025 |
FY2 2026 |
FY3 2027 |
FY4 2028 |
FY5 2029 |
|---|---|---|---|---|---|---|---|---|---|---|
| Revenue | 2,053.1 | 2,255.3 | 2,886.3 | 2,839.0 | 2,656.1 | 2,853.6 | 3,065.8 | 3,293.8 | 3,538.7 | 3,801.9 |
| Revenue Growth, % | 0 | 9.85 | 27.98 | -1.64 | -6.44 | 7.44 | 7.44 | 7.44 | 7.44 | 7.44 |
| EBITDA | 74.4 | 98.0 | 141.5 | 158.5 | 157.0 | 139.1 | 149.4 | 160.5 | 172.5 | 185.3 |
| EBITDA, % | 3.63 | 4.35 | 4.9 | 5.58 | 5.91 | 4.87 | 4.87 | 4.87 | 4.87 | 4.87 |
| Depreciation | 48.8 | 44.2 | 44.3 | 45.4 | 46.1 | 52.5 | 56.4 | 60.6 | 65.1 | 70.0 |
| Depreciation, % | 2.38 | 1.96 | 1.53 | 1.6 | 1.74 | 1.84 | 1.84 | 1.84 | 1.84 | 1.84 |
| EBIT | 25.7 | 53.9 | 97.2 | 113.1 | 110.8 | 86.5 | 93.0 | 99.9 | 107.3 | 115.3 |
| EBIT, % | 1.25 | 2.39 | 3.37 | 3.98 | 4.17 | 3.03 | 3.03 | 3.03 | 3.03 | 3.03 |
| Total Cash | 390.8 | 271.7 | 207.4 | 277.4 | 315.2 | 341.9 | 367.3 | 394.6 | 424.0 | 455.5 |
| Total Cash, percent | .0 | .0 | .0 | .0 | .0 | .0 | .0 | .0 | .0 | .0 |
| Account Receivables | 452.5 | 511.5 | 675.6 | 624.4 | 580.0 | 639.0 | 686.5 | 737.5 | 792.4 | 851.3 |
| Account Receivables, % | 22.04 | 22.68 | 23.41 | 21.99 | 21.84 | 22.39 | 22.39 | 22.39 | 22.39 | 22.39 |
| Inventories | 327.4 | 523.2 | 727.7 | 683.8 | 553.7 | 623.7 | 670.1 | 720.0 | 773.5 | 831.0 |
| Inventories, % | 15.95 | 23.2 | 25.21 | 24.09 | 20.84 | 21.86 | 21.86 | 21.86 | 21.86 | 21.86 |
| Accounts Payable | 282.2 | 426.6 | 424.3 | 367.5 | 354.2 | 420.3 | 451.5 | 485.1 | 521.2 | 559.9 |
| Accounts Payable, % | 13.75 | 18.91 | 14.7 | 12.94 | 13.34 | 14.73 | 14.73 | 14.73 | 14.73 | 14.73 |
| Capital Expenditure | -39.5 | -42.2 | -43.4 | -77.7 | -33.3 | -53.0 | -56.9 | -61.2 | -65.7 | -70.6 |
| Capital Expenditure, % | -1.92 | -1.87 | -1.5 | -2.74 | -1.25 | -1.86 | -1.86 | -1.86 | -1.86 | -1.86 |
| Tax Rate, % | 24.52 | 24.52 | 24.52 | 24.52 | 24.52 | 24.52 | 24.52 | 24.52 | 24.52 | 24.52 |
| EBITAT | 20.9 | 42.4 | 78.7 | 89.6 | 83.6 | 68.5 | 73.6 | 79.0 | 84.9 | 91.2 |
| Depreciation | ||||||||||
| Changes in Account Receivables | ||||||||||
| Changes in Inventories | ||||||||||
| Changes in Accounts Payable | ||||||||||
| Capital Expenditure | ||||||||||
| UFCF | -467.6 | -66.0 | -291.3 | 95.6 | 257.8 | 5.0 | 10.4 | 11.2 | 12.0 | 12.9 |
| WACC, % | 8.2 | 8.17 | 8.2 | 8.17 | 8.12 | 8.17 | 8.17 | 8.17 | 8.17 | 8.17 |
| PV UFCF | ||||||||||
| SUM PV UFCF | 39.9 | |||||||||
| Long Term Growth Rate, % | 3.50 | |||||||||
| Free cash flow (T + 1) | 13 | |||||||||
| Terminal Value | 286 | |||||||||
| Present Terminal Value | 193 | |||||||||
| Enterprise Value | 233 | |||||||||
| Net Debt | 51 | |||||||||
| Equity Value | 182 | |||||||||
| Diluted Shares Outstanding, MM | 37 | |||||||||
| Equity Value Per Share | 4.95 |
What You Will Get
- Real Benchmark Data: Preloaded financials – from revenue to EBIT – based on actual and projected figures for Benchmark Electronics, Inc. (BHE).
- Full Customization: Adjust all critical parameters (yellow cells) like WACC, growth %, and tax rates to fit your analysis.
- Instant Valuation Updates: Automatic recalculations to analyze the impact of changes on Benchmark Electronics' fair value.
- Versatile Excel Template: Tailored for quick edits, scenario testing, and detailed projections specific to Benchmark Electronics, Inc. (BHE).
- Time-Saving and Accurate: Skip building models from scratch while maintaining precision and flexibility in your financial assessments.
Key Features
- Comprehensive BHE Data: Pre-loaded with Benchmark Electronics’ historical performance metrics and future forecasts.
- Customizable Assumptions: Modify revenue growth, profit margins, discount rates, tax assumptions, and capital investments.
- Interactive Valuation Framework: Real-time updates to Net Present Value (NPV) and intrinsic value based on user inputs.
- Scenario Analysis: Develop various forecasting scenarios to evaluate different valuation possibilities.
- Intuitive Interface: Clean, organized layout suitable for both seasoned professionals and newcomers.
How It Works
- Download: Get the pre-prepared Excel file containing Benchmark Electronics, Inc.'s (BHE) financial data.
- Customize: Modify forecasts such as revenue growth, EBITDA %, and WACC to fit your analysis.
- Update Automatically: Enjoy real-time updates on intrinsic value and NPV calculations.
- Test Scenarios: Develop various projections and instantly compare different outcomes.
- Make Decisions: Leverage the valuation results to inform your investment choices.
Why Choose This Calculator for Benchmark Electronics, Inc. (BHE)?
- Designed for Experts: A sophisticated tool utilized by industry analysts, financial officers, and consultants.
- Accurate Data: Benchmark's historical and projected financials preloaded for precise calculations.
- Flexible Scenario Analysis: Effortlessly simulate various forecasts and assumptions.
- Detailed Outputs: Automatically computes intrinsic value, NPV, and essential financial metrics.
- User-Friendly: Comprehensive step-by-step instructions simplify the process.
Who Should Use Benchmark Electronics, Inc. (BHE)?
- Investors: Gain insights into the electronics manufacturing sector with reliable performance metrics.
- Financial Analysts: Streamline your analysis with comprehensive reports and data tailored for BHE.
- Consultants: Easily modify data for client presentations or strategic recommendations.
- Tech Enthusiasts: Enhance your knowledge of the electronics industry through detailed case studies and trends.
- Educators and Students: Utilize it as a resource for understanding the complexities of the electronics market.
What the Template Contains
- Comprehensive DCF Model: Editable template featuring detailed valuation calculations.
- Real-World Data: Benchmark Electronics, Inc.'s (BHE) historical and projected financials preloaded for analysis.
- Customizable Parameters: Modify WACC, growth rates, and tax assumptions to explore various scenarios.
- Financial Statements: Complete annual and quarterly breakdowns for enhanced insights.
- Key Ratios: Integrated analysis for profitability, efficiency, and leverage metrics.
- Dashboard with Visual Outputs: Visualizations including charts and tables for clear, actionable results.
Disclaimer
All information, articles, and product details provided on this website are for general informational and educational purposes only. We do not claim any ownership over, nor do we intend to infringe upon, any trademarks, copyrights, logos, brand names, or other intellectual property mentioned or depicted on this site. Such intellectual property remains the property of its respective owners, and any references here are made solely for identification or informational purposes, without implying any affiliation, endorsement, or partnership.
We make no representations or warranties, express or implied, regarding the accuracy, completeness, or suitability of any content or products presented. Nothing on this website should be construed as legal, tax, investment, financial, medical, or other professional advice. In addition, no part of this site—including articles or product references—constitutes a solicitation, recommendation, endorsement, advertisement, or offer to buy or sell any securities, franchises, or other financial instruments, particularly in jurisdictions where such activity would be unlawful.
All content is of a general nature and may not address the specific circumstances of any individual or entity. It is not a substitute for professional advice or services. Any actions you take based on the information provided here are strictly at your own risk. You accept full responsibility for any decisions or outcomes arising from your use of this website and agree to release us from any liability in connection with your use of, or reliance upon, the content or products found herein.