
|
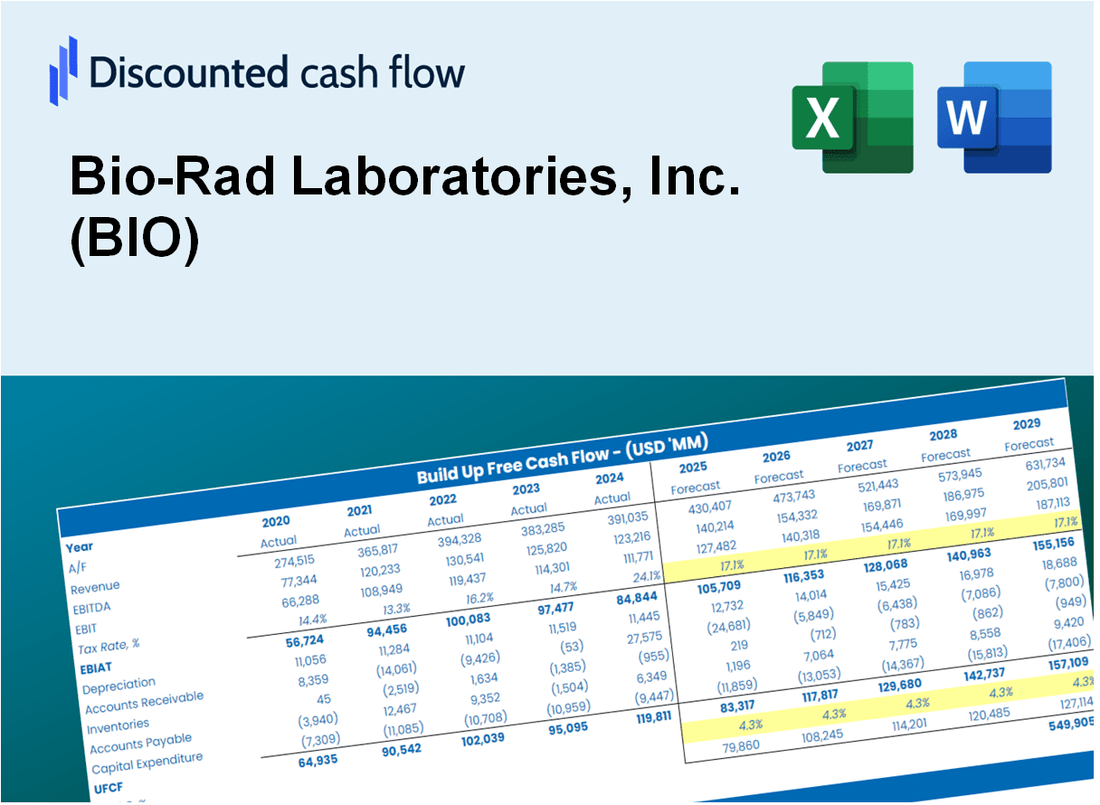
Bio-Rad Laboratories ، Inc. (Bio) DCF تقييم |
Fully Editable: Tailor To Your Needs In Excel Or Sheets
Professional Design: Trusted, Industry-Standard Templates
Investor-Approved Valuation Models
MAC/PC Compatible, Fully Unlocked
No Expertise Is Needed; Easy To Follow
Bio-Rad Laboratories, Inc. (BIO) Bundle
هل تبحث عن قيمة Bio-Rad Laboratories ، Inc. الجوهرية؟ يدمج حاسبة Bio DCF الخاصة بنا البيانات الواقعية مع ميزات تخصيص شاملة ، مما يتيح لك تحسين التوقعات وتعزيز استراتيجيات الاستثمار الخاصة بك.
Discounted Cash Flow (DCF) - (USD MM)
| Year | AY1 2020 |
AY2 2021 |
AY3 2022 |
AY4 2023 |
AY5 2024 |
FY1 2025 |
FY2 2026 |
FY3 2027 |
FY4 2028 |
FY5 2029 |
|---|---|---|---|---|---|---|---|---|---|---|
| Revenue | 2,545.6 | 2,922.5 | 2,802.2 | 2,671.3 | 2,566.5 | 2,579.9 | 2,593.4 | 2,607.0 | 2,620.7 | 2,634.4 |
| Revenue Growth, % | 0 | 14.81 | -4.12 | -4.67 | -3.92 | 0.52356 | 0.52356 | 0.52356 | 0.52356 | 0.52356 |
| EBITDA | 5,078.5 | 5,588.2 | -4,489.0 | -654.8 | -2,142.0 | -41.1 | -41.4 | -41.6 | -41.8 | -42.0 |
| EBITDA, % | 199.5 | 191.21 | -160.19 | -24.51 | -83.46 | -1.59 | -1.59 | -1.59 | -1.59 | -1.59 |
| Depreciation | 138.6 | 137.6 | 177.2 | 145.9 | 151.6 | 143.7 | 144.4 | 145.2 | 145.9 | 146.7 |
| Depreciation, % | 5.44 | 4.71 | 6.32 | 5.46 | 5.91 | 5.57 | 5.57 | 5.57 | 5.57 | 5.57 |
| EBIT | 4,939.9 | 5,450.6 | -4,666.2 | -800.7 | -2,293.6 | -99.8 | -100.3 | -100.8 | -101.4 | -101.9 |
| EBIT, % | 194.05 | 186.5 | -166.51 | -29.97 | -89.37 | -3.87 | -3.87 | -3.87 | -3.87 | -3.87 |
| Total Cash | 991.1 | 869.9 | 1,790.7 | 1,607.1 | 1,664.5 | 1,329.3 | 1,336.2 | 1,343.2 | 1,350.3 | 1,357.3 |
| Total Cash, percent | .0 | .0 | .0 | .0 | .0 | .0 | .0 | .0 | .0 | .0 |
| Account Receivables | 419.4 | 423.5 | 494.6 | 489.0 | 452.5 | 436.3 | 438.6 | 440.9 | 443.2 | 445.5 |
| Account Receivables, % | 16.48 | 14.49 | 17.65 | 18.31 | 17.63 | 16.91 | 16.91 | 16.91 | 16.91 | 16.91 |
| Inventories | 622.3 | 572.2 | 719.3 | 780.5 | 760.0 | 663.2 | 666.6 | 670.1 | 673.6 | 677.2 |
| Inventories, % | 24.44 | 19.58 | 25.67 | 29.22 | 29.61 | 25.7 | 25.7 | 25.7 | 25.7 | 25.7 |
| Accounts Payable | 139.5 | 141.9 | 135.0 | 144.6 | 122.3 | 130.7 | 131.4 | 132.1 | 132.8 | 133.5 |
| Accounts Payable, % | 5.48 | 4.86 | 4.82 | 5.41 | 4.77 | 5.07 | 5.07 | 5.07 | 5.07 | 5.07 |
| Capital Expenditure | -108.6 | -133.7 | -114.2 | -156.7 | -189.0 | -134.9 | -135.6 | -136.3 | -137.0 | -137.7 |
| Capital Expenditure, % | -4.26 | -4.58 | -4.07 | -5.87 | -7.36 | -5.23 | -5.23 | -5.23 | -5.23 | -5.23 |
| Tax Rate, % | 21.27 | 21.27 | 21.27 | 21.27 | 21.27 | 21.27 | 21.27 | 21.27 | 21.27 | 21.27 |
| EBITAT | 3,831.2 | 4,255.5 | -3,598.1 | -600.3 | -1,805.7 | -77.1 | -77.5 | -77.9 | -78.4 | -78.8 |
| Depreciation | ||||||||||
| Changes in Account Receivables | ||||||||||
| Changes in Inventories | ||||||||||
| Changes in Accounts Payable | ||||||||||
| Capital Expenditure | ||||||||||
| UFCF | 2,959.0 | 4,307.7 | -3,760.2 | -657.0 | -1,808.4 | 53.1 | -73.8 | -74.2 | -74.6 | -75.0 |
| WACC, % | 7.43 | 7.44 | 7.43 | 7.42 | 7.44 | 7.43 | 7.43 | 7.43 | 7.43 | 7.43 |
| PV UFCF | ||||||||||
| SUM PV UFCF | -182.7 | |||||||||
| Long Term Growth Rate, % | 0.50 | |||||||||
| Free cash flow (T + 1) | -75 | |||||||||
| Terminal Value | -1,087 | |||||||||
| Present Terminal Value | -759 | |||||||||
| Enterprise Value | -942 | |||||||||
| Net Debt | 887 | |||||||||
| Equity Value | -1,829 | |||||||||
| Diluted Shares Outstanding, MM | 28 | |||||||||
| Equity Value Per Share | -64.81 |
What You Will Get
- Editable Excel Template: A fully customizable Excel-based DCF Calculator featuring pre-filled real BIO financials.
- Real-World Data: Historical data and forward-looking estimates (as indicated in the yellow cells).
- Forecast Flexibility: Adjust forecast assumptions such as revenue growth, EBITDA %, and WACC.
- Automatic Calculations: Instantly observe the effect of your inputs on Bio-Rad's valuation.
- Professional Tool: Designed for investors, CFOs, consultants, and financial analysts.
- User-Friendly Design: Organized for clarity and ease of use, complete with step-by-step instructions.
Key Features
- Comprehensive DCF Calculator: Features detailed unlevered and levered DCF valuation models tailored for Bio-Rad Laboratories, Inc. (BIO).
- WACC Calculator: Pre-configured Weighted Average Cost of Capital sheet with adjustable inputs specific to Bio-Rad.
- Customizable Forecast Assumptions: Adjust growth rates, capital expenditures, and discount rates to fit Bio-Rad's financial strategies.
- Integrated Financial Ratios: Evaluate profitability, leverage, and efficiency ratios relevant to Bio-Rad Laboratories, Inc. (BIO).
- Visual Dashboard and Charts: Graphical representations summarize key valuation metrics for streamlined analysis.
How It Works
- Step 1: Download the prebuilt Excel template with Bio-Rad Laboratories, Inc.'s (BIO) data included.
- Step 2: Explore the pre-filled sheets and understand the key metrics.
- Step 3: Update forecasts and assumptions in the editable yellow cells (WACC, growth, margins).
- Step 4: Instantly view recalculated results, including Bio-Rad Laboratories, Inc.'s (BIO) intrinsic value.
- Step 5: Make informed investment decisions or generate reports using the outputs.
Why Choose This Calculator?
- User-Friendly Interface: Tailored for both novices and seasoned professionals.
- Customizable Inputs: Modify parameters easily to suit your specific analysis.
- Real-Time Adjustments: Observe immediate changes to Bio-Rad’s valuation as you tweak inputs.
- Preloaded Data: Comes with Bio-Rad’s actual financial metrics for swift evaluations.
- Relied Upon by Experts: Favored by investors and analysts for making well-informed choices.
Who Should Use This Product?
- Investors: Accurately assess Bio-Rad’s fair value before making investment choices.
- CFOs: Utilize a high-quality DCF model for financial reporting and analysis.
- Consultants: Easily customize the template for valuation reports tailored to clients.
- Entrepreneurs: Acquire insights into financial modeling practices employed by leading biotech firms.
- Educators: Implement it as a teaching resource to illustrate valuation techniques.
What the Template Contains
- Operating and Balance Sheet Data: Pre-filled Bio-Rad Laboratories historical data and forecasts, including revenue, EBITDA, EBIT, and capital expenditures.
- WACC Calculation: A dedicated sheet for Weighted Average Cost of Capital (WACC), including parameters like Beta, risk-free rate, and share price.
- DCF Valuation (Unlevered and Levered): Editable Discounted Cash Flow models showing intrinsic value with detailed calculations.
- Financial Statements: Pre-loaded financial statements (annual and quarterly) to support analysis.
- Key Ratios: Includes profitability, leverage, and efficiency ratios for Bio-Rad Laboratories, Inc. (BIO).
- Dashboard and Charts: Visual summary of valuation outputs and assumptions to analyze results easily.
Disclaimer
All information, articles, and product details provided on this website are for general informational and educational purposes only. We do not claim any ownership over, nor do we intend to infringe upon, any trademarks, copyrights, logos, brand names, or other intellectual property mentioned or depicted on this site. Such intellectual property remains the property of its respective owners, and any references here are made solely for identification or informational purposes, without implying any affiliation, endorsement, or partnership.
We make no representations or warranties, express or implied, regarding the accuracy, completeness, or suitability of any content or products presented. Nothing on this website should be construed as legal, tax, investment, financial, medical, or other professional advice. In addition, no part of this site—including articles or product references—constitutes a solicitation, recommendation, endorsement, advertisement, or offer to buy or sell any securities, franchises, or other financial instruments, particularly in jurisdictions where such activity would be unlawful.
All content is of a general nature and may not address the specific circumstances of any individual or entity. It is not a substitute for professional advice or services. Any actions you take based on the information provided here are strictly at your own risk. You accept full responsibility for any decisions or outcomes arising from your use of this website and agree to release us from any liability in connection with your use of, or reliance upon, the content or products found herein.