
|
Blackline ، Inc. (BL) DCF تقييم |
Fully Editable: Tailor To Your Needs In Excel Or Sheets
Professional Design: Trusted, Industry-Standard Templates
Investor-Approved Valuation Models
MAC/PC Compatible, Fully Unlocked
No Expertise Is Needed; Easy To Follow
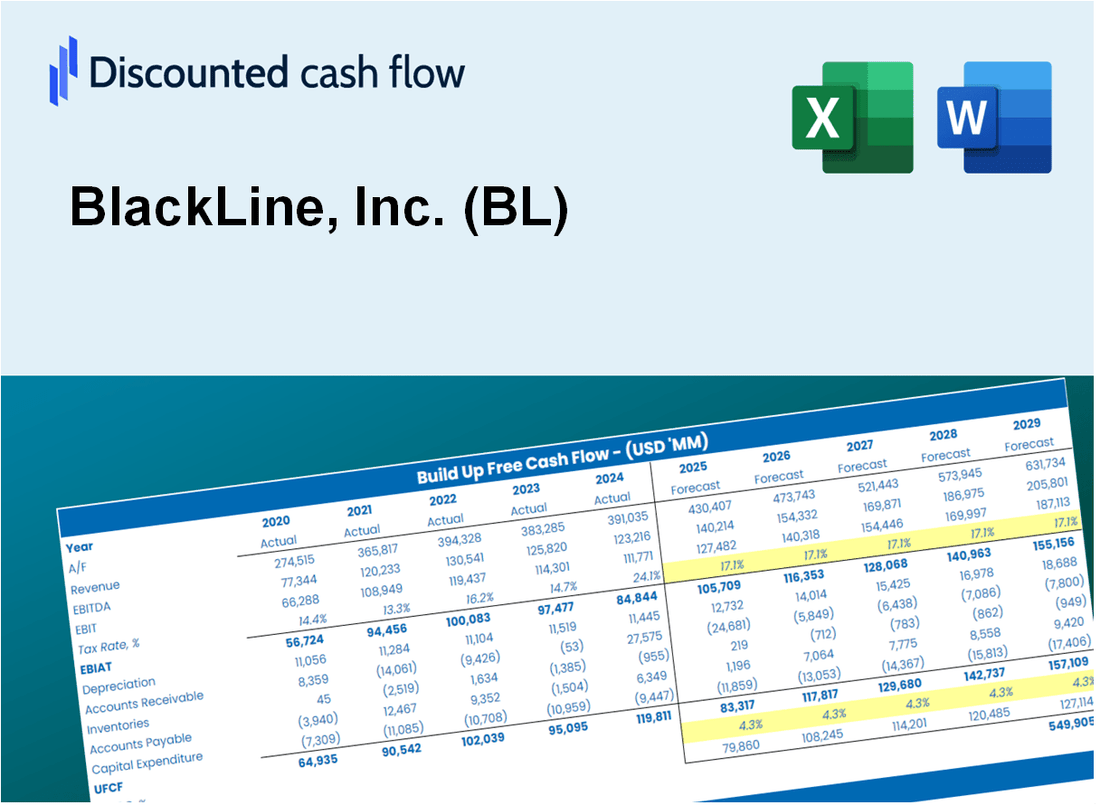
BlackLine, Inc. (BL) Bundle
Simplify Blackline ، Inc. (BL) التقييم مع هذه الآلة الحاسبة DCF القابلة للتخصيص! يضم REAL Blackline ، Inc. (BL) البيانات المالية والمدخلات المتوقعة القابلة للتعديل ، يمكنك اختبار السيناريوهات و Decover Blackline ، Inc. (BL) القيمة العادلة في دقائق.
Discounted Cash Flow (DCF) - (USD MM)
| Year | AY1 2020 |
AY2 2021 |
AY3 2022 |
AY4 2023 |
AY5 2024 |
FY1 2025 |
FY2 2026 |
FY3 2027 |
FY4 2028 |
FY5 2029 |
|---|---|---|---|---|---|---|---|---|---|---|
| Revenue | 351.7 | 425.7 | 522.9 | 590.0 | 653.3 | 763.5 | 892.2 | 1,042.6 | 1,218.3 | 1,423.7 |
| Revenue Growth, % | 0 | 21.03 | 22.84 | 12.82 | 10.74 | 16.86 | 16.86 | 16.86 | 16.86 | 16.86 |
| EBITDA | 5.5 | -10.8 | 1.3 | 116.5 | 183.8 | 72.0 | 84.1 | 98.3 | 114.9 | 134.3 |
| EBITDA, % | 1.56 | -2.53 | 0.23999 | 19.75 | 28.13 | 9.43 | 9.43 | 9.43 | 9.43 | 9.43 |
| Depreciation | 20.9 | 27.1 | 42.8 | 50.1 | 50.3 | 56.0 | 65.5 | 76.5 | 89.4 | 104.5 |
| Depreciation, % | 5.94 | 6.37 | 8.19 | 8.49 | 7.71 | 7.34 | 7.34 | 7.34 | 7.34 | 7.34 |
| EBIT | -15.4 | -37.9 | -41.6 | 66.4 | 133.5 | 16.0 | 18.7 | 21.8 | 25.5 | 29.8 |
| EBIT, % | -4.38 | -8.91 | -7.95 | 11.26 | 20.43 | 2.09 | 2.09 | 2.09 | 2.09 | 2.09 |
| Total Cash | 542.6 | 1,198.7 | 1,075.1 | 1,204.5 | 885.9 | 763.5 | 892.2 | 1,042.6 | 1,218.3 | 1,423.7 |
| Total Cash, percent | .0 | .0 | .0 | .0 | .0 | .0 | .0 | .0 | .0 | .0 |
| Account Receivables | 111.3 | 125.1 | 150.9 | 171.6 | 178.1 | 223.3 | 260.9 | 304.9 | 356.3 | 416.4 |
| Account Receivables, % | 31.63 | 29.39 | 28.85 | 29.09 | 27.27 | 29.25 | 29.25 | 29.25 | 29.25 | 29.25 |
| Inventories | .0 | .0 | .0 | .0 | .0 | .0 | .0 | .0 | .0 | .0 |
| Inventories, % | 0 | 0 | 0 | 0 | 0 | 0 | 0 | 0 | 0 | 0 |
| Accounts Payable | 3.2 | 7.5 | 15.0 | 8.6 | 8.5 | 12.6 | 14.8 | 17.2 | 20.1 | 23.5 |
| Accounts Payable, % | 0.89556 | 1.75 | 2.86 | 1.46 | 1.3 | 1.65 | 1.65 | 1.65 | 1.65 | 1.65 |
| Capital Expenditure | -19.4 | -23.3 | -30.2 | -27.6 | -2.1 | -33.2 | -38.8 | -45.4 | -53.0 | -62.0 |
| Capital Expenditure, % | -5.52 | -5.47 | -5.77 | -4.68 | -0.32541 | -4.35 | -4.35 | -4.35 | -4.35 | -4.35 |
| Tax Rate, % | -29.25 | -29.25 | -29.25 | -29.25 | -29.25 | -29.25 | -29.25 | -29.25 | -29.25 | -29.25 |
| EBITAT | -18.7 | -43.3 | -25.8 | 58.0 | 172.5 | 14.3 | 16.8 | 19.6 | 22.9 | 26.7 |
| Depreciation | ||||||||||
| Changes in Account Receivables | ||||||||||
| Changes in Inventories | ||||||||||
| Changes in Accounts Payable | ||||||||||
| Capital Expenditure | ||||||||||
| UFCF | -125.3 | -49.0 | -31.4 | 53.4 | 214.0 | -3.8 | 7.9 | 9.2 | 10.8 | 12.6 |
| WACC, % | 7.12 | 7.12 | 6.86 | 7.03 | 7.12 | 7.05 | 7.05 | 7.05 | 7.05 | 7.05 |
| PV UFCF | ||||||||||
| SUM PV UFCF | 28.0 | |||||||||
| Long Term Growth Rate, % | 2.00 | |||||||||
| Free cash flow (T + 1) | 13 | |||||||||
| Terminal Value | 255 | |||||||||
| Present Terminal Value | 181 | |||||||||
| Enterprise Value | 209 | |||||||||
| Net Debt | 31 | |||||||||
| Equity Value | 179 | |||||||||
| Diluted Shares Outstanding, MM | 74 | |||||||||
| Equity Value Per Share | 2.43 |
What You Will Get
- Real BlackLine Data: Preloaded financials – from revenue to EBIT – based on actual and projected figures.
- Full Customization: Adjust all critical parameters (yellow cells) like WACC, growth %, and tax rates.
- Instant Valuation Updates: Automatic recalculations to analyze the impact of changes on BlackLine’s fair value.
- Versatile Excel Template: Tailored for quick edits, scenario testing, and detailed projections.
- Time-Saving and Accurate: Skip building models from scratch while maintaining precision and flexibility.
Key Features
- Real-Life BL Data: Pre-filled with BlackLine’s historical financials and future projections.
- Fully Customizable Inputs: Modify revenue growth, profit margins, WACC, tax rates, and capital expenditures.
- Dynamic Valuation Model: Instant updates to Net Present Value (NPV) and intrinsic value based on your adjustments.
- Scenario Testing: Develop multiple forecasting scenarios to evaluate various valuation outcomes.
- User-Friendly Design: Intuitive, organized, and crafted for both professionals and newcomers.
How It Works
- Download the Template: Gain immediate access to the Excel-based BL DCF Calculator.
- Input Your Assumptions: Modify the yellow-highlighted cells for growth rates, WACC, margins, and other variables.
- Instant Calculations: The model automatically recalculates BlackLine’s intrinsic value.
- Test Scenarios: Experiment with various assumptions to assess potential valuation impacts.
- Analyze and Decide: Utilize the findings to inform your investment or financial analysis.
Why Choose This Calculator for BlackLine, Inc. (BL)?
- Accurate Data: Utilize real BlackLine financials for dependable valuation outcomes.
- Customizable: Tailor essential parameters such as growth rates, WACC, and tax rates to fit your forecasts.
- Time-Saving: Pre-configured calculations save you from starting from the ground up.
- Professional-Grade Tool: Crafted for investors, analysts, and financial consultants.
- User-Friendly: Clear layout and guided instructions make it accessible for all users.
Who Should Use BlackLine, Inc. (BL)?
- Accountants: Streamline your financial close process with advanced automation tools.
- Finance Teams: Enhance efficiency and accuracy in financial reporting with integrated solutions.
- Consultants: Tailor the platform for client needs and improve their financial operations.
- Business Leaders: Gain insights into financial performance and drive strategic decisions.
- Students and Educators: Explore practical applications of accounting technology in academic settings.
What the Template Contains
- Preloaded BL Data: Historical and projected financial data, including revenue, EBIT, and capital expenditures.
- DCF and WACC Models: Professional-grade sheets for calculating intrinsic value and Weighted Average Cost of Capital.
- Editable Inputs: Yellow-highlighted cells for adjusting revenue growth, tax rates, and discount rates.
- Financial Statements: Comprehensive annual and quarterly financials for deeper analysis.
- Key Ratios: Profitability, leverage, and efficiency ratios to evaluate performance.
- Dashboard and Charts: Visual summaries of valuation outcomes and assumptions.
Disclaimer
All information, articles, and product details provided on this website are for general informational and educational purposes only. We do not claim any ownership over, nor do we intend to infringe upon, any trademarks, copyrights, logos, brand names, or other intellectual property mentioned or depicted on this site. Such intellectual property remains the property of its respective owners, and any references here are made solely for identification or informational purposes, without implying any affiliation, endorsement, or partnership.
We make no representations or warranties, express or implied, regarding the accuracy, completeness, or suitability of any content or products presented. Nothing on this website should be construed as legal, tax, investment, financial, medical, or other professional advice. In addition, no part of this site—including articles or product references—constitutes a solicitation, recommendation, endorsement, advertisement, or offer to buy or sell any securities, franchises, or other financial instruments, particularly in jurisdictions where such activity would be unlawful.
All content is of a general nature and may not address the specific circumstances of any individual or entity. It is not a substitute for professional advice or services. Any actions you take based on the information provided here are strictly at your own risk. You accept full responsibility for any decisions or outcomes arising from your use of this website and agree to release us from any liability in connection with your use of, or reliance upon, the content or products found herein.