
|
شركة Blink Charging Co. (BLNK) DCF تقييم |
Fully Editable: Tailor To Your Needs In Excel Or Sheets
Professional Design: Trusted, Industry-Standard Templates
Investor-Approved Valuation Models
MAC/PC Compatible, Fully Unlocked
No Expertise Is Needed; Easy To Follow
Blink Charging Co. (BLNK) Bundle
تبسيط تقييم Blink Charging Co. (BLNK) مع هذه الآلة الحاسبة DCF القابلة للتخصيص! يتميز شركة REAL Blink Charging Co.
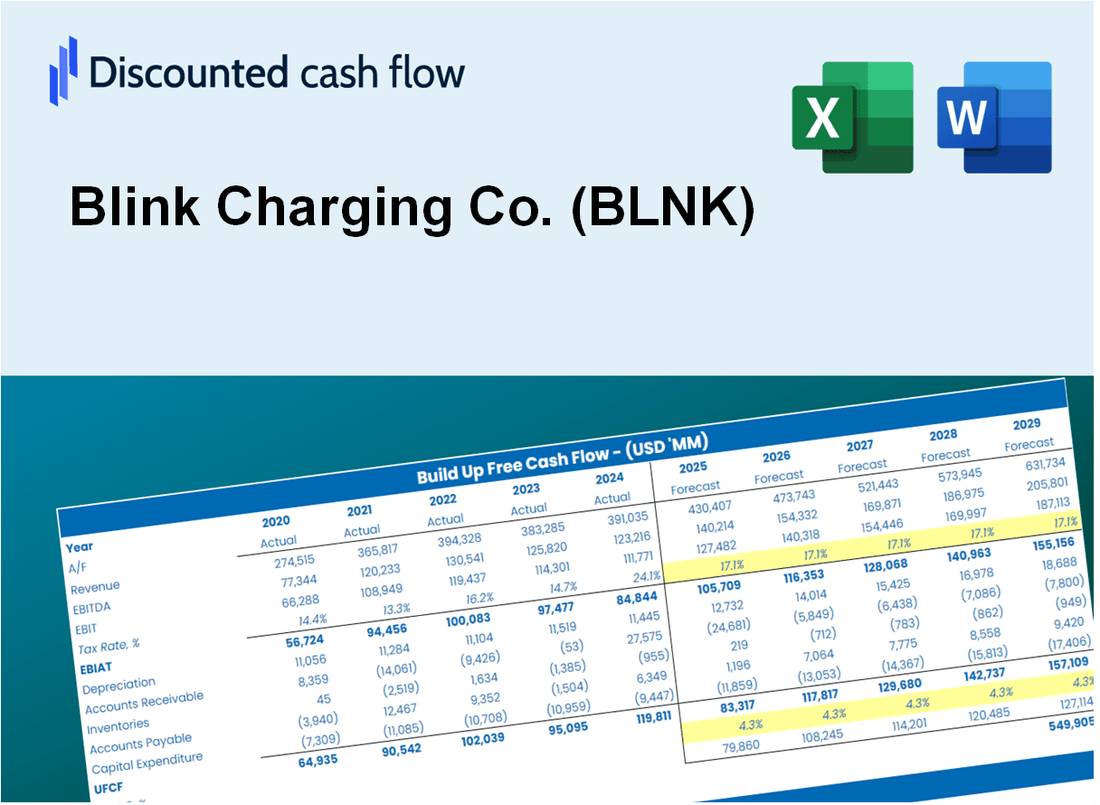
Discounted Cash Flow (DCF) - (USD MM)
| Year | AY1 2020 |
AY2 2021 |
AY3 2022 |
AY4 2023 |
AY5 2024 |
FY1 2025 |
FY2 2026 |
FY3 2027 |
FY4 2028 |
FY5 2029 |
|---|---|---|---|---|---|---|---|---|---|---|
| Revenue | 6.2 | 20.5 | 60.8 | 140.1 | 124.5 | 214.4 | 369.2 | 635.8 | 1,094.9 | 1,885.6 |
| Revenue Growth, % | 0 | 230.81 | 196.22 | 130.31 | -11.16 | 72.21 | 72.21 | 72.21 | 72.21 | 72.21 |
| EBITDA | -17.1 | -52.9 | -80.2 | -186.2 | -183.6 | -214.4 | -369.2 | -635.8 | -1,094.9 | -1,885.6 |
| EBITDA, % | -275.95 | -257.73 | -131.78 | -132.89 | -147.46 | -100 | -100 | -100 | -100 | -100 |
| Depreciation | .7 | 2.7 | 9.5 | 12.4 | 13.4 | 25.5 | 44.0 | 75.8 | 130.5 | 224.7 |
| Depreciation, % | 10.95 | 13.3 | 15.69 | 8.88 | 10.77 | 11.92 | 11.92 | 11.92 | 11.92 | 11.92 |
| EBIT | -17.8 | -55.7 | -89.7 | -198.7 | -197.0 | -214.4 | -369.2 | -635.8 | -1,094.9 | -1,885.6 |
| EBIT, % | -286.91 | -271.03 | -147.47 | -141.76 | -158.23 | -100 | -100 | -100 | -100 | -100 |
| Total Cash | 22.3 | 174.8 | 36.6 | 121.7 | 55.4 | 167.8 | 289.0 | 497.8 | 857.2 | 1,476.2 |
| Total Cash, percent | .0 | .0 | .0 | .0 | .0 | .0 | .0 | .0 | .0 | .0 |
| Account Receivables | .3 | 6.3 | 23.6 | 45.4 | 43.2 | 61.1 | 105.1 | 181.1 | 311.8 | 537.0 |
| Account Receivables, % | 5.6 | 30.9 | 38.76 | 32.43 | 34.7 | 28.48 | 28.48 | 28.48 | 28.48 | 28.48 |
| Inventories | 1.8 | 10.4 | 34.7 | 47.9 | 38.3 | 86.5 | 149.0 | 256.6 | 441.9 | 761.0 |
| Inventories, % | 29.25 | 50.48 | 57.1 | 34.21 | 30.75 | 40.36 | 40.36 | 40.36 | 40.36 | 40.36 |
| Accounts Payable | 3.4 | 7.1 | 24.6 | 31.2 | 28.9 | 74.9 | 129.0 | 222.2 | 382.6 | 658.8 |
| Accounts Payable, % | 54.1 | 34.73 | 40.41 | 22.26 | 23.2 | 34.94 | 34.94 | 34.94 | 34.94 | 34.94 |
| Capital Expenditure | -2.5 | -7.3 | -5.5 | -8.6 | -8.6 | -42.3 | -72.9 | -125.5 | -216.2 | -372.3 |
| Capital Expenditure, % | -41.02 | -35.55 | -9.11 | -6.12 | -6.92 | -19.75 | -19.75 | -19.75 | -19.75 | -19.75 |
| Tax Rate, % | -0.36167 | -0.36167 | -0.36167 | -0.36167 | -0.36167 | -0.36167 | -0.36167 | -0.36167 | -0.36167 | -0.36167 |
| EBITAT | -17.8 | -55.7 | -90.0 | -200.1 | -197.7 | -214.4 | -369.2 | -635.8 | -1,094.9 | -1,885.6 |
| Depreciation | ||||||||||
| Changes in Account Receivables | ||||||||||
| Changes in Inventories | ||||||||||
| Changes in Accounts Payable | ||||||||||
| Capital Expenditure | ||||||||||
| UFCF | -18.5 | -71.0 | -110.2 | -224.7 | -183.3 | -251.2 | -450.6 | -775.9 | -1,336.3 | -2,301.2 |
| WACC, % | 11.98 | 11.98 | 11.98 | 11.98 | 11.98 | 11.98 | 11.98 | 11.98 | 11.98 | 11.98 |
| PV UFCF | ||||||||||
| SUM PV UFCF | -3,293.0 | |||||||||
| Long Term Growth Rate, % | 2.00 | |||||||||
| Free cash flow (T + 1) | -2,347 | |||||||||
| Terminal Value | -23,518 | |||||||||
| Present Terminal Value | -13,356 | |||||||||
| Enterprise Value | -16,649 | |||||||||
| Net Debt | -31 | |||||||||
| Equity Value | -16,618 | |||||||||
| Diluted Shares Outstanding, MM | 101 | |||||||||
| Equity Value Per Share | -164.79 |
What You Will Get
- Editable Forecast Inputs: Easily modify assumptions (growth %, margins, WACC) to explore various scenarios.
- Real-World Data: Blink Charging Co.’s (BLNK) financial data pre-filled to kickstart your analysis.
- Automatic DCF Outputs: The template computes Net Present Value (NPV) and intrinsic value automatically.
- Customizable and Professional: A sleek Excel model that adjusts to your valuation requirements.
- Built for Analysts and Investors: Perfect for evaluating projections, confirming strategies, and enhancing efficiency.
Key Features
- Accurate Blink Charging Financials: Access reliable pre-loaded historical data and future forecasts.
- Customizable Forecast Parameters: Modify highlighted cells for key metrics like WACC, growth rates, and profit margins.
- Real-Time Calculations: Automatic updates to DCF, Net Present Value (NPV), and cash flow assessments.
- Interactive Dashboard: User-friendly charts and summaries to visualize your valuation insights.
- Designed for All Users: An intuitive layout tailored for investors, CFOs, and consultants alike.
How It Works
- Step 1: Download the Excel file.
- Step 2: Review Blink Charging Co.’s pre-filled financial data and forecasts.
- Step 3: Modify critical inputs like revenue growth, WACC, and tax rates (highlighted cells).
- Step 4: Watch the DCF model update instantly as you tweak assumptions.
- Step 5: Analyze the outputs and use the results for investment decisions.
Why Choose Blink Charging Co. (BLNK)?
- Innovative Solutions: Cutting-edge charging technology designed for the modern electric vehicle market.
- Enhanced Accessibility: Extensive network of charging stations ensures convenience for users.
- Sustainable Focus: Committed to promoting clean energy and reducing carbon footprints.
- User-Friendly Experience: Intuitive interfaces and seamless integration for both businesses and consumers.
- Industry Leadership: Recognized as a trusted provider by businesses and municipalities alike.
Who Should Use This Product?
- Investors: Evaluate Blink Charging Co.'s (BLNK) market position before making investment decisions.
- CFOs and Financial Analysts: Optimize valuation methodologies and assess financial forecasts for Blink Charging Co. (BLNK).
- Startup Founders: Understand the valuation strategies of leading companies in the EV charging sector like Blink Charging Co. (BLNK).
- Consultants: Prepare comprehensive valuation reports tailored for clients interested in Blink Charging Co. (BLNK).
- Students and Educators: Utilize current market data to practice and instruct on valuation techniques with a focus on Blink Charging Co. (BLNK).
What the Template Contains
- Historical Data: Includes Blink Charging Co.’s (BLNK) past financials and baseline forecasts.
- DCF and Levered DCF Models: Detailed templates to calculate Blink Charging Co.’s (BLNK) intrinsic value.
- WACC Sheet: Pre-built calculations for Weighted Average Cost of Capital.
- Editable Inputs: Modify key drivers like growth rates, EBITDA %, and CAPEX assumptions.
- Quarterly and Annual Statements: A complete breakdown of Blink Charging Co.’s (BLNK) financials.
- Interactive Dashboard: Visualize valuation results and projections dynamically.
Disclaimer
All information, articles, and product details provided on this website are for general informational and educational purposes only. We do not claim any ownership over, nor do we intend to infringe upon, any trademarks, copyrights, logos, brand names, or other intellectual property mentioned or depicted on this site. Such intellectual property remains the property of its respective owners, and any references here are made solely for identification or informational purposes, without implying any affiliation, endorsement, or partnership.
We make no representations or warranties, express or implied, regarding the accuracy, completeness, or suitability of any content or products presented. Nothing on this website should be construed as legal, tax, investment, financial, medical, or other professional advice. In addition, no part of this site—including articles or product references—constitutes a solicitation, recommendation, endorsement, advertisement, or offer to buy or sell any securities, franchises, or other financial instruments, particularly in jurisdictions where such activity would be unlawful.
All content is of a general nature and may not address the specific circumstances of any individual or entity. It is not a substitute for professional advice or services. Any actions you take based on the information provided here are strictly at your own risk. You accept full responsibility for any decisions or outcomes arising from your use of this website and agree to release us from any liability in connection with your use of, or reliance upon, the content or products found herein.