
|
تقييم بنك مارين بانكورب (BMRC) DCF |
Fully Editable: Tailor To Your Needs In Excel Or Sheets
Professional Design: Trusted, Industry-Standard Templates
Investor-Approved Valuation Models
MAC/PC Compatible, Fully Unlocked
No Expertise Is Needed; Easy To Follow
Bank of Marin Bancorp (BMRC) Bundle
اكتساب نظرة ثاقبة على تحليل التقييم بنك Marin Bancorp (BMRC) مع حاسبة DCF المتطورة! يأتي قالب Excel هذا مسبقًا مع بيانات BMRC الحقيقية ، مما يتيح لك ضبط التوقعات والافتراضات لحساب دقيق لقيمة Marin Bancorp الجوهرية.
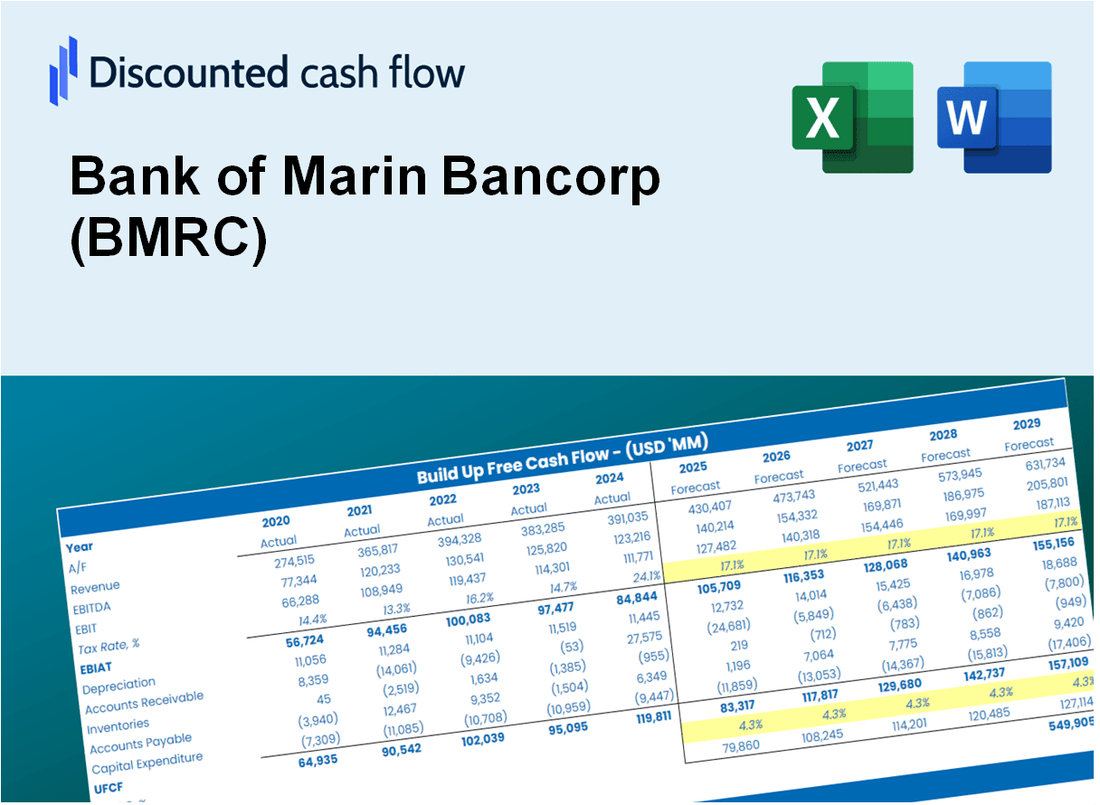
Discounted Cash Flow (DCF) - (USD MM)
| Year | AY1 2020 |
AY2 2021 |
AY3 2022 |
AY4 2023 |
AY5 2024 |
FY1 2025 |
FY2 2026 |
FY3 2027 |
FY4 2028 |
FY5 2029 |
|---|---|---|---|---|---|---|---|---|---|---|
| Revenue | 108.2 | 118.5 | 140.7 | 141.7 | 116.4 | 119.6 | 122.9 | 126.4 | 129.9 | 133.5 |
| Revenue Growth, % | 0 | 9.49 | 18.77 | 0.71932 | -17.86 | 2.78 | 2.78 | 2.78 | 2.78 | 2.78 |
| EBITDA | 43.6 | 47.8 | 66.8 | 29.5 | -11.4 | 33.3 | 34.2 | 35.2 | 36.1 | 37.1 |
| EBITDA, % | 40.29 | 40.32 | 47.51 | 20.81 | -9.79 | 27.83 | 27.83 | 27.83 | 27.83 | 27.83 |
| Depreciation | 3.0 | 2.9 | 3.3 | 3.4 | 2.4 | 2.9 | 3.0 | 3.1 | 3.1 | 3.2 |
| Depreciation, % | 2.77 | 2.43 | 2.37 | 2.43 | 2.1 | 2.42 | 2.42 | 2.42 | 2.42 | 2.42 |
| EBIT | 40.6 | 44.9 | 63.5 | 26.0 | -13.8 | 30.4 | 31.2 | 32.1 | 33.0 | 33.9 |
| EBIT, % | 37.52 | 37.89 | 45.14 | 18.37 | -11.89 | 25.41 | 25.41 | 25.41 | 25.41 | 25.41 |
| Total Cash | 592.7 | 1,515.2 | 46.7 | 30.6 | 273.0 | 84.9 | 87.2 | 89.6 | 92.1 | 94.7 |
| Total Cash, percent | .0 | .0 | .0 | .0 | .0 | .0 | .0 | .0 | .0 | .0 |
| Account Receivables | 36.5 | 51.4 | 79.8 | .0 | .0 | 32.0 | 32.9 | 33.8 | 34.8 | 35.7 |
| Account Receivables, % | 33.72 | 43.36 | 56.74 | 0 | 0 | 26.76 | 26.76 | 26.76 | 26.76 | 26.76 |
| Inventories | .0 | .0 | .0 | .0 | .0 | .0 | .0 | .0 | .0 | .0 |
| Inventories, % | 0 | 0 | 0 | 0 | 0 | 0 | 0 | 0 | 0 | 0 |
| Accounts Payable | 19.5 | 29.4 | 22.9 | .0 | .0 | 14.2 | 14.6 | 15.0 | 15.4 | 15.8 |
| Accounts Payable, % | 18.05 | 24.86 | 16.31 | 0 | 0 | 11.84 | 11.84 | 11.84 | 11.84 | 11.84 |
| Capital Expenditure | -1.0 | -1.0 | -2.3 | -1.7 | -.5 | -1.2 | -1.2 | -1.3 | -1.3 | -1.4 |
| Capital Expenditure, % | -0.90675 | -0.88132 | -1.61 | -1.23 | -0.44679 | -1.02 | -1.02 | -1.02 | -1.02 | -1.02 |
| Tax Rate, % | 39.22 | 39.22 | 39.22 | 39.22 | 39.22 | 39.22 | 39.22 | 39.22 | 39.22 | 39.22 |
| EBITAT | 30.2 | 33.2 | 46.6 | 19.9 | -8.4 | 21.8 | 22.4 | 23.1 | 23.7 | 24.4 |
| Depreciation | ||||||||||
| Changes in Account Receivables | ||||||||||
| Changes in Inventories | ||||||||||
| Changes in Accounts Payable | ||||||||||
| Capital Expenditure | ||||||||||
| UFCF | 15.3 | 30.1 | 12.7 | 78.5 | -6.5 | 5.7 | 23.7 | 24.3 | 25.0 | 25.7 |
| WACC, % | 16.25 | 16.19 | 16.11 | 16.48 | 14.59 | 15.92 | 15.92 | 15.92 | 15.92 | 15.92 |
| PV UFCF | ||||||||||
| SUM PV UFCF | 64.2 | |||||||||
| Long Term Growth Rate, % | 2.00 | |||||||||
| Free cash flow (T + 1) | 26 | |||||||||
| Terminal Value | 188 | |||||||||
| Present Terminal Value | 90 | |||||||||
| Enterprise Value | 154 | |||||||||
| Net Debt | -116 | |||||||||
| Equity Value | 270 | |||||||||
| Diluted Shares Outstanding, MM | 16 | |||||||||
| Equity Value Per Share | 16.82 |
What You Will Get
- Real BMRC Financials: Access to historical and projected data for precise valuation.
- Customizable Inputs: Adjust WACC, tax rates, revenue growth, and capital expenditures as needed.
- Dynamic Calculations: Intrinsic value and NPV are computed automatically.
- Scenario Analysis: Evaluate various scenarios to assess Bank of Marin Bancorp's future performance.
- User-Friendly Design: Designed for professionals while remaining easy to use for newcomers.
Key Features
- Comprehensive DCF Calculator: Features detailed unlevered and levered DCF valuation models tailored for Bank of Marin Bancorp (BMRC).
- WACC Calculator: Pre-configured Weighted Average Cost of Capital sheet with adjustable inputs specific to BMRC.
- Customizable Forecast Assumptions: Adjust growth rates, capital expenditures, and discount rates to suit your analysis of BMRC.
- Integrated Financial Ratios: Evaluate profitability, leverage, and efficiency ratios for Bank of Marin Bancorp (BMRC).
- Interactive Dashboard and Charts: Visual representations summarize essential valuation metrics for straightforward analysis.
How It Works
- Step 1: Download the Excel file for Bank of Marin Bancorp (BMRC).
- Step 2: Review the pre-filled financial data and forecasts for Bank of Marin Bancorp (BMRC).
- Step 3: Adjust key inputs such as revenue growth, WACC, and tax rates (highlighted cells).
- Step 4: Observe the DCF model update in real-time as you modify your assumptions.
- Step 5: Evaluate the outputs and leverage the results for your investment decisions regarding Bank of Marin Bancorp (BMRC).
Why Choose This Calculator for Bank of Marin Bancorp (BMRC)?
- User-Friendly Interface: Tailored for both novices and seasoned professionals.
- Customizable Inputs: Easily adjust parameters to suit your financial analysis.
- Real-Time Feedback: Observe immediate changes to Bank of Marin Bancorp’s valuation as you modify inputs.
- Preconfigured Data: Comes with Bank of Marin Bancorp’s actual financial figures for swift evaluations.
- Relied Upon by Experts: Utilized by investors and analysts for making well-informed decisions.
Who Should Use Bank of Marin Bancorp (BMRC)?
- Investors: Make informed investment choices with a trusted financial institution.
- Small Business Owners: Access tailored banking solutions to support your growth.
- Community Members: Benefit from local banking services that prioritize personal relationships.
- Financial Advisors: Collaborate with a bank that understands your client's needs.
- Individuals Seeking Home Loans: Explore competitive mortgage options for your dream home.
What the Template Contains
- Preloaded BMRC Data: Historical and projected financial data, including revenue, EBIT, and capital expenditures.
- DCF and WACC Models: Professional-grade sheets for calculating intrinsic value and Weighted Average Cost of Capital.
- Editable Inputs: Yellow-highlighted cells for adjusting revenue growth, tax rates, and discount rates.
- Financial Statements: Comprehensive annual and quarterly financials for deeper analysis.
- Key Ratios: Profitability, leverage, and efficiency ratios to evaluate performance.
- Dashboard and Charts: Visual summaries of valuation outcomes and assumptions.
Disclaimer
All information, articles, and product details provided on this website are for general informational and educational purposes only. We do not claim any ownership over, nor do we intend to infringe upon, any trademarks, copyrights, logos, brand names, or other intellectual property mentioned or depicted on this site. Such intellectual property remains the property of its respective owners, and any references here are made solely for identification or informational purposes, without implying any affiliation, endorsement, or partnership.
We make no representations or warranties, express or implied, regarding the accuracy, completeness, or suitability of any content or products presented. Nothing on this website should be construed as legal, tax, investment, financial, medical, or other professional advice. In addition, no part of this site—including articles or product references—constitutes a solicitation, recommendation, endorsement, advertisement, or offer to buy or sell any securities, franchises, or other financial instruments, particularly in jurisdictions where such activity would be unlawful.
All content is of a general nature and may not address the specific circumstances of any individual or entity. It is not a substitute for professional advice or services. Any actions you take based on the information provided here are strictly at your own risk. You accept full responsibility for any decisions or outcomes arising from your use of this website and agree to release us from any liability in connection with your use of, or reliance upon, the content or products found herein.