
|
تقييم بنك هاواي (BOH) DCF تقييم |
Fully Editable: Tailor To Your Needs In Excel Or Sheets
Professional Design: Trusted, Industry-Standard Templates
Investor-Approved Valuation Models
MAC/PC Compatible, Fully Unlocked
No Expertise Is Needed; Easy To Follow
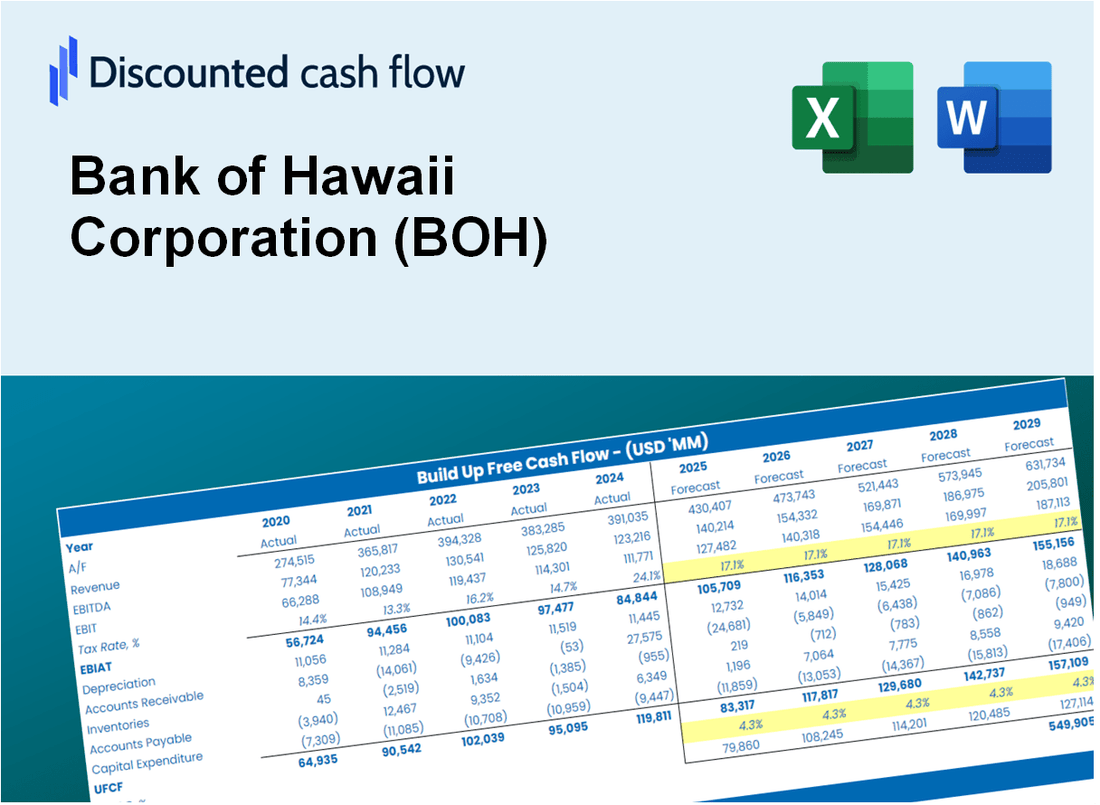
Bank of Hawaii Corporation (BOH) Bundle
ابسط تقييم شركة بنك هاواي (BOH) باستخدام حاسبة DCF القابلة للتخصيص! تعرض البيانات المالية الحقيقية لشركة بنك هاواي (BOH) ومدخلات التوقعات القابلة للتعديل، يمكنك اختبار السيناريوهات والكشف عن القيمة العادلة لشركة بنك هاواي (BOH) في دقائق.
Discounted Cash Flow (DCF) - (USD MM)
| Year | AY1 2020 |
AY2 2021 |
AY3 2022 |
AY4 2023 |
AY5 2024 |
FY1 2025 |
FY2 2026 |
FY3 2027 |
FY4 2028 |
FY5 2029 |
|---|---|---|---|---|---|---|---|---|---|---|
| Revenue | 730.8 | 689.4 | 754.9 | 965.8 | 1,029.5 | 1,128.2 | 1,236.5 | 1,355.1 | 1,485.0 | 1,627.4 |
| Revenue Growth, % | 0 | -5.67 | 9.5 | 27.93 | 6.6 | 9.59 | 9.59 | 9.59 | 9.59 | 9.59 |
| EBITDA | 221.6 | 358.1 | 323.9 | 260.1 | 229.4 | 393.5 | 431.2 | 472.6 | 517.9 | 567.6 |
| EBITDA, % | 30.32 | 51.95 | 42.9 | 26.93 | 22.28 | 34.88 | 34.88 | 34.88 | 34.88 | 34.88 |
| Depreciation | 32.5 | 32.6 | 33.2 | 33.0 | 31.5 | 45.2 | 49.6 | 54.3 | 59.5 | 65.3 |
| Depreciation, % | 4.45 | 4.73 | 4.4 | 3.42 | 3.06 | 4.01 | 4.01 | 4.01 | 4.01 | 4.01 |
| EBIT | 189.1 | 325.6 | 290.6 | 227.1 | 197.9 | 348.3 | 381.7 | 418.3 | 458.4 | 502.3 |
| EBIT, % | 25.88 | 47.22 | 38.5 | 23.52 | 19.22 | 30.87 | 30.87 | 30.87 | 30.87 | 30.87 |
| Total Cash | 4,072.8 | 4,475.0 | 3,165.2 | 3,409.9 | 2,616.0 | 1,128.2 | 1,236.5 | 1,355.1 | 1,485.0 | 1,627.4 |
| Total Cash, percent | .0 | .0 | .0 | .0 | .0 | .0 | .0 | .0 | .0 | .0 |
| Account Receivables | 167.8 | 160.7 | 139.9 | 141.2 | 172.1 | 216.9 | 237.7 | 260.5 | 285.5 | 312.9 |
| Account Receivables, % | 22.96 | 23.31 | 18.53 | 14.62 | 16.72 | 19.23 | 19.23 | 19.23 | 19.23 | 19.23 |
| Inventories | .0 | .0 | .0 | .0 | .0 | .0 | .0 | .0 | .0 | .0 |
| Inventories, % | 0 | 0 | 0 | 0 | 0 | 0 | 0 | 0 | 0 | 0 |
| Accounts Payable | 5.1 | 2.5 | 9.7 | 41.0 | 34.8 | 22.5 | 24.7 | 27.0 | 29.6 | 32.5 |
| Accounts Payable, % | 0.70016 | 0.36248 | 1.28 | 4.25 | 3.38 | 2 | 2 | 2 | 2 | 2 |
| Capital Expenditure | -33.3 | -22.4 | -28.8 | -9.4 | -9.7 | -30.5 | -33.4 | -36.6 | -40.2 | -44.0 |
| Capital Expenditure, % | -4.55 | -3.25 | -3.81 | -0.97352 | -0.94016 | -2.7 | -2.7 | -2.7 | -2.7 | -2.7 |
| Tax Rate, % | 24.19 | 24.19 | 24.19 | 24.19 | 24.19 | 24.19 | 24.19 | 24.19 | 24.19 | 24.19 |
| EBITAT | 153.8 | 253.4 | 225.8 | 171.2 | 150.0 | 270.3 | 296.2 | 324.6 | 355.7 | 389.9 |
| Depreciation | ||||||||||
| Changes in Account Receivables | ||||||||||
| Changes in Inventories | ||||||||||
| Changes in Accounts Payable | ||||||||||
| Capital Expenditure | ||||||||||
| UFCF | -9.7 | 268.1 | 258.3 | 224.7 | 134.7 | 227.9 | 293.7 | 321.9 | 352.7 | 386.5 |
| WACC, % | 15.22 | 14.81 | 14.79 | 14.52 | 14.57 | 14.78 | 14.78 | 14.78 | 14.78 | 14.78 |
| PV UFCF | ||||||||||
| SUM PV UFCF | 1,031.4 | |||||||||
| Long Term Growth Rate, % | 2.00 | |||||||||
| Free cash flow (T + 1) | 394 | |||||||||
| Terminal Value | 3,084 | |||||||||
| Present Terminal Value | 1,548 | |||||||||
| Enterprise Value | 2,579 | |||||||||
| Net Debt | -17 | |||||||||
| Equity Value | 2,596 | |||||||||
| Diluted Shares Outstanding, MM | 40 | |||||||||
| Equity Value Per Share | 65.39 |
What You Will Get
- Real BOH Financials: Access to historical and projected data for precise valuation.
- Adjustable Inputs: Customize WACC, tax rates, revenue growth, and capital expenditures.
- Automatic Calculations: Intrinsic value and NPV are computed in real-time.
- Scenario Analysis: Evaluate various scenarios to assess Bank of Hawaii's future performance.
- Clear and Intuitive Design: Designed for professionals, yet user-friendly for newcomers.
Key Features
- Customizable Financial Metrics: Adjust essential inputs such as loan growth, net interest margin, and operating expenses.
- Instant DCF Valuation: Quickly determines intrinsic value, NPV, and other key metrics.
- High-Precision Accuracy: Leverages Bank of Hawaii's real-world financial data for credible valuation results.
- Effortless Scenario Analysis: Evaluate various assumptions and assess results with ease.
- Efficiency Booster: Avoid the hassle of creating intricate valuation models from the ground up.
How It Works
- 1. Access the Template: Download and open the Excel file containing Bank of Hawaii Corporation’s (BOH) preloaded data.
- 2. Adjust Assumptions: Modify key inputs such as growth rates, WACC, and capital expenditures.
- 3. View Results Instantly: The DCF model automatically calculates intrinsic value and NPV.
- 4. Explore Scenarios: Analyze various forecasts to compare different valuation outcomes.
- 5. Present with Confidence: Deliver professional valuation insights to bolster your decision-making.
Why Choose This Calculator for Bank of Hawaii Corporation (BOH)?
- Accuracy: Utilizes real Bank of Hawaii financials for precise data.
- Flexibility: Allows users to easily adjust and test various inputs.
- Time-Saving: Avoid the complexities of creating a DCF model from the ground up.
- Professional-Grade: Crafted with the expertise and usability expected at the CFO level.
- User-Friendly: Designed for ease of use, suitable for all skill levels in financial modeling.
Who Should Use Bank of Hawaii Corporation (BOH)?
- Investors: Gain insights and make informed decisions with a reliable banking partner.
- Financial Analysts: Utilize comprehensive financial data to streamline your analysis and reporting.
- Business Owners: Access tailored banking solutions to support your growth and operational needs.
- Individuals: Manage your personal finances effectively with user-friendly banking services.
- Students and Educators: Explore real-world banking scenarios and case studies for educational purposes.
What the Template Contains
- Pre-Filled DCF Model: Bank of Hawaii Corporation’s (BOH) financial data preloaded for immediate use.
- WACC Calculator: Detailed calculations for Weighted Average Cost of Capital.
- Financial Ratios: Evaluate Bank of Hawaii Corporation’s (BOH) profitability, leverage, and efficiency.
- Editable Inputs: Change assumptions such as growth, margins, and CAPEX to fit your scenarios.
- Financial Statements: Annual and quarterly reports to support detailed analysis.
- Interactive Dashboard: Easily visualize key valuation metrics and results.
Disclaimer
All information, articles, and product details provided on this website are for general informational and educational purposes only. We do not claim any ownership over, nor do we intend to infringe upon, any trademarks, copyrights, logos, brand names, or other intellectual property mentioned or depicted on this site. Such intellectual property remains the property of its respective owners, and any references here are made solely for identification or informational purposes, without implying any affiliation, endorsement, or partnership.
We make no representations or warranties, express or implied, regarding the accuracy, completeness, or suitability of any content or products presented. Nothing on this website should be construed as legal, tax, investment, financial, medical, or other professional advice. In addition, no part of this site—including articles or product references—constitutes a solicitation, recommendation, endorsement, advertisement, or offer to buy or sell any securities, franchises, or other financial instruments, particularly in jurisdictions where such activity would be unlawful.
All content is of a general nature and may not address the specific circumstances of any individual or entity. It is not a substitute for professional advice or services. Any actions you take based on the information provided here are strictly at your own risk. You accept full responsibility for any decisions or outcomes arising from your use of this website and agree to release us from any liability in connection with your use of, or reliance upon, the content or products found herein.