
|
ب. Better Online Solutions Ltd. (BOSC) تقييم DCF |
Fully Editable: Tailor To Your Needs In Excel Or Sheets
Professional Design: Trusted, Industry-Standard Templates
Investor-Approved Valuation Models
MAC/PC Compatible, Fully Unlocked
No Expertise Is Needed; Easy To Follow
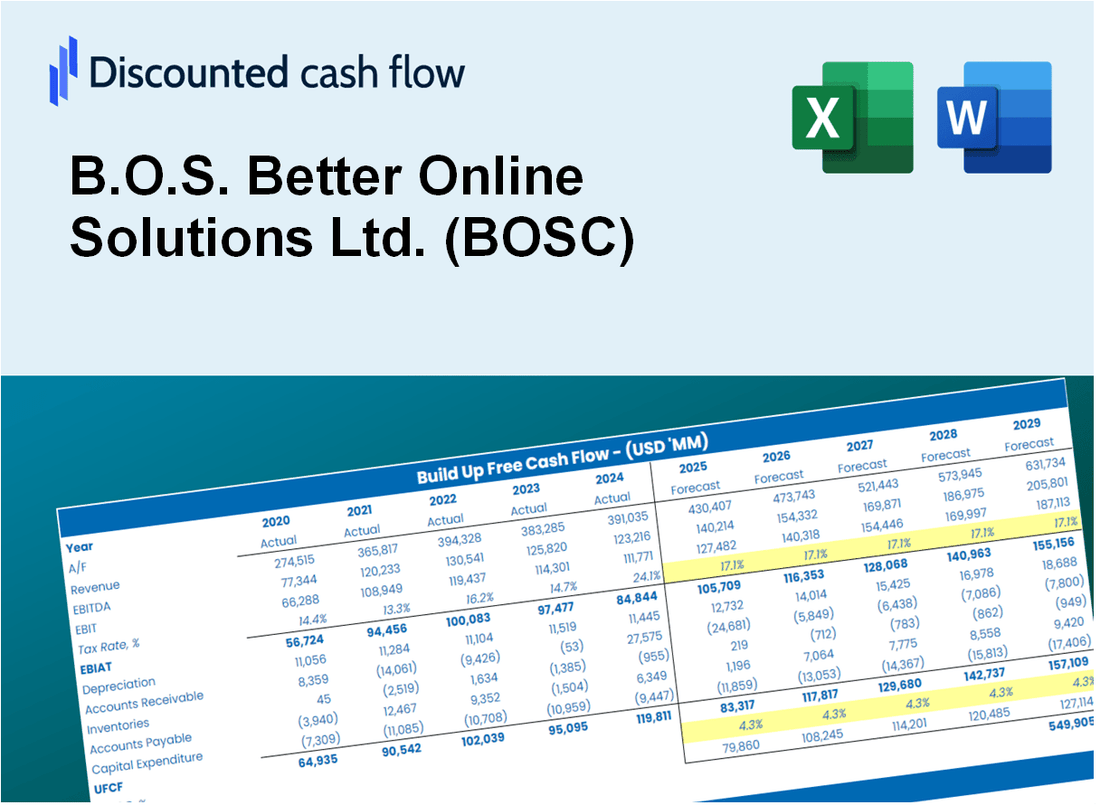
B.O.S. Better Online Solutions Ltd. (BOSC) Bundle
تتطلع إلى تقييم القيمة الجوهرية لـ B.O.S. حلول أفضل عبر الإنترنت المحدودة؟ يدمج حاسبة DCF (BOSC) DCF بيانات حقيقية مع ميزات تخصيص واسعة ، مما يتيح لك تحسين توقعاتك واتخاذ خيارات استثمار أكثر استنارة.
Discounted Cash Flow (DCF) - (USD MM)
| Year | AY1 2020 |
AY2 2021 |
AY3 2022 |
AY4 2023 |
AY5 2024 |
FY1 2025 |
FY2 2026 |
FY3 2027 |
FY4 2028 |
FY5 2029 |
|---|---|---|---|---|---|---|---|---|---|---|
| Revenue | 33.6 | 33.6 | 41.5 | 44.2 | 39.9 | 42.0 | 44.2 | 46.4 | 48.8 | 51.3 |
| Revenue Growth, % | 0 | 0.24738 | 23.42 | 6.43 | -9.57 | 5.13 | 5.13 | 5.13 | 5.13 | 5.13 |
| EBITDA | -.3 | .9 | 2.3 | 3.0 | 2.1 | 1.6 | 1.7 | 1.8 | 1.8 | 1.9 |
| EBITDA, % | -1.03 | 2.59 | 5.52 | 6.7 | 5.15 | 3.79 | 3.79 | 3.79 | 3.79 | 3.79 |
| Depreciation | .3 | .3 | .4 | .5 | .6 | .4 | .5 | .5 | .5 | .5 |
| Depreciation, % | 0.92695 | 0.76708 | 0.86965 | 1.16 | 1.4 | 1.02 | 1.02 | 1.02 | 1.02 | 1.02 |
| EBIT | -.7 | .6 | 1.9 | 2.4 | 1.5 | 1.2 | 1.2 | 1.3 | 1.3 | 1.4 |
| EBIT, % | -1.95 | 1.83 | 4.65 | 5.54 | 3.75 | 2.76 | 2.76 | 2.76 | 2.76 | 2.76 |
| Total Cash | 1.0 | 1.9 | 1.8 | 2.3 | 3.4 | 2.2 | 2.4 | 2.5 | 2.6 | 2.7 |
| Total Cash, percent | .0 | .0 | .0 | .0 | .0 | .0 | .0 | .0 | .0 | .0 |
| Account Receivables | 9.4 | 9.4 | 11.1 | 12.6 | 12.0 | 11.9 | 12.5 | 13.1 | 13.8 | 14.5 |
| Account Receivables, % | 28.06 | 28.05 | 26.74 | 28.59 | 30.12 | 28.32 | 28.32 | 28.32 | 28.32 | 28.32 |
| Inventories | 4.9 | 5.6 | 6.4 | 6.1 | 7.9 | 6.7 | 7.1 | 7.4 | 7.8 | 8.2 |
| Inventories, % | 14.52 | 16.55 | 15.5 | 13.74 | 19.7 | 16 | 16 | 16 | 16 | 16 |
| Accounts Payable | 5.5 | 5.2 | 8.0 | 7.7 | 6.4 | 7.1 | 7.5 | 7.8 | 8.2 | 8.7 |
| Accounts Payable, % | 16.37 | 15.46 | 19.23 | 17.45 | 15.93 | 16.89 | 16.89 | 16.89 | 16.89 | 16.89 |
| Capital Expenditure | -.1 | -.4 | -2.4 | -.3 | -.5 | -.8 | -.8 | -.9 | -.9 | -1.0 |
| Capital Expenditure, % | -0.25037 | -1.13 | -5.85 | -0.77186 | -1.3 | -1.86 | -1.86 | -1.86 | -1.86 | -1.86 |
| Tax Rate, % | -76.92 | -76.92 | -76.92 | -76.92 | -76.92 | -76.92 | -76.92 | -76.92 | -76.92 | -76.92 |
| EBITAT | -.7 | .7 | 1.9 | 2.4 | 2.6 | 1.2 | 1.2 | 1.3 | 1.3 | 1.4 |
| Depreciation | ||||||||||
| Changes in Account Receivables | ||||||||||
| Changes in Inventories | ||||||||||
| Changes in Accounts Payable | ||||||||||
| Capital Expenditure | ||||||||||
| UFCF | -9.2 | -.5 | .1 | 1.2 | .1 | 2.8 | .3 | .3 | .3 | .3 |
| WACC, % | 9.12 | 9.12 | 9.12 | 9.12 | 9.12 | 9.12 | 9.12 | 9.12 | 9.12 | 9.12 |
| PV UFCF | ||||||||||
| SUM PV UFCF | 3.4 | |||||||||
| Long Term Growth Rate, % | 0.50 | |||||||||
| Free cash flow (T + 1) | 0 | |||||||||
| Terminal Value | 4 | |||||||||
| Present Terminal Value | 2 | |||||||||
| Enterprise Value | 6 | |||||||||
| Net Debt | -1 | |||||||||
| Equity Value | 7 | |||||||||
| Diluted Shares Outstanding, MM | 6 | |||||||||
| Equity Value Per Share | 1.17 |
What You Will Receive
- Comprehensive Financial Model: B.O.S. Better Online Solutions Ltd.’s (BOSC) actual data provides accurate DCF valuation.
- Complete Forecast Flexibility: Modify revenue growth, profit margins, WACC, and other essential parameters.
- Real-Time Calculations: Automatic updates allow you to view results instantly as adjustments are made.
- Professional-Grade Template: A polished Excel file crafted for high-quality valuation presentations.
- Adaptable and Reusable: Designed for versatility, enabling repeated application for in-depth forecasts.
Key Features
- Customizable Forecast Inputs: Adjust essential factors such as revenue growth, EBITDA %, and capital expenses.
- Instant DCF Valuation: Provides immediate calculations for intrinsic value, NPV, and additional metrics.
- High-Precision Results: Leverages B.O.S. Better Online Solutions Ltd.’s (BOSC) actual financial data for accurate valuation results.
- Effortless Scenario Testing: Easily evaluate various assumptions and analyze different outcomes.
- Efficiency Booster: Streamline your process by avoiding the complexity of creating valuation models from the ground up.
How It Works
- Step 1: Download the Excel file.
- Step 2: Review pre-entered B.O.S. Better Online Solutions Ltd. (BOSC) data (historical and projected).
- Step 3: Adjust key assumptions (yellow cells) based on your analysis.
- Step 4: View automatic recalculations for B.O.S. Better Online Solutions Ltd. (BOSC)’s intrinsic value.
- Step 5: Use the outputs for investment decisions or reporting.
Why Choose B.O.S. Better Online Solutions Ltd. (BOSC)?
- Reliable Insights: Access to accurate data ensures dependable analysis for your online solutions.
- Flexible Options: Tailor essential variables such as service parameters, pricing models, and client specifications to suit your needs.
- Efficiency Boost: Built-in features streamline processes, saving you valuable time.
- Industry-Standard Tool: Crafted for business owners, digital marketers, and IT professionals.
- Easy to Navigate: User-friendly design and clear guidance make it accessible for everyone.
Who Should Use B.O.S. Better Online Solutions Ltd. (BOSC)?
- Investors: Evaluate B.O.S.C.'s market position before making investment decisions.
- CFOs and Financial Analysts: Enhance financial analysis and forecasting for B.O.S.C.
- Startup Founders: Understand the valuation strategies of successful online solutions companies like B.O.S.C.
- Consultants: Provide expert valuation insights and reports to clients regarding B.O.S.C.
- Students and Educators: Utilize B.O.S.C.'s data to teach and learn about business valuation methods.
What the Template Contains
- Preloaded BOSC Data: Historical and projected financial data, including revenue, EBIT, and capital expenditures.
- DCF and WACC Models: Professional-grade sheets for calculating intrinsic value and Weighted Average Cost of Capital.
- Editable Inputs: Yellow-highlighted cells for adjusting revenue growth, tax rates, and discount rates.
- Financial Statements: Comprehensive annual and quarterly financials for deeper analysis.
- Key Ratios: Profitability, leverage, and efficiency ratios to evaluate performance.
- Dashboard and Charts: Visual summaries of valuation outcomes and assumptions.
Disclaimer
All information, articles, and product details provided on this website are for general informational and educational purposes only. We do not claim any ownership over, nor do we intend to infringe upon, any trademarks, copyrights, logos, brand names, or other intellectual property mentioned or depicted on this site. Such intellectual property remains the property of its respective owners, and any references here are made solely for identification or informational purposes, without implying any affiliation, endorsement, or partnership.
We make no representations or warranties, express or implied, regarding the accuracy, completeness, or suitability of any content or products presented. Nothing on this website should be construed as legal, tax, investment, financial, medical, or other professional advice. In addition, no part of this site—including articles or product references—constitutes a solicitation, recommendation, endorsement, advertisement, or offer to buy or sell any securities, franchises, or other financial instruments, particularly in jurisdictions where such activity would be unlawful.
All content is of a general nature and may not address the specific circumstances of any individual or entity. It is not a substitute for professional advice or services. Any actions you take based on the information provided here are strictly at your own risk. You accept full responsibility for any decisions or outcomes arising from your use of this website and agree to release us from any liability in connection with your use of, or reliance upon, the content or products found herein.