
|
BP P.L.C. (BP) تقييم DCF |
Fully Editable: Tailor To Your Needs In Excel Or Sheets
Professional Design: Trusted, Industry-Standard Templates
Investor-Approved Valuation Models
MAC/PC Compatible, Fully Unlocked
No Expertise Is Needed; Easy To Follow
BP p.l.c. (BP) Bundle
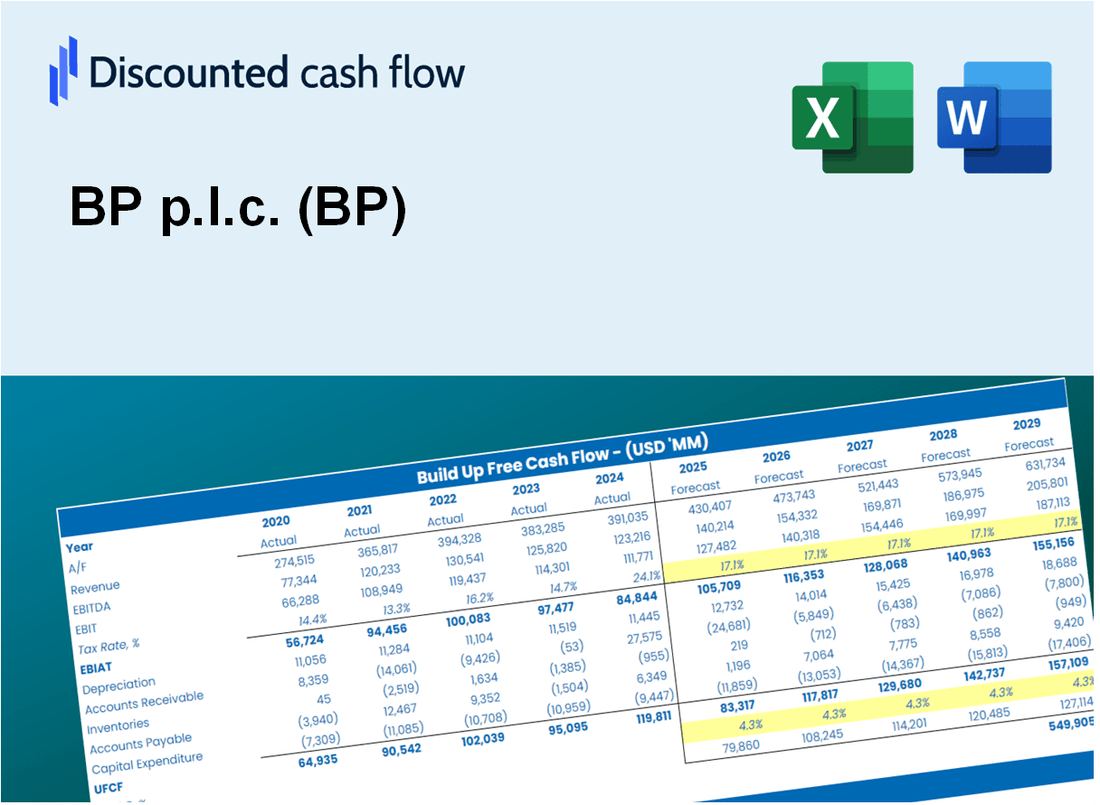
تم تصميمه من أجل الدقة، وتمكنك حاسبة DCF (BP) من تقييم BP p.l. باستخدام البيانات المالية الواقعية مع توفير المرونة الكاملة لتعديل جميع البارامترات الأساسية لتحسين التنبؤات.
Discounted Cash Flow (DCF) - (USD MM)
| Year | AY1 2020 |
AY2 2021 |
AY3 2022 |
AY4 2023 |
AY5 2024 |
FY1 2025 |
FY2 2026 |
FY3 2027 |
FY4 2028 |
FY5 2029 |
|---|---|---|---|---|---|---|---|---|---|---|
| Revenue | 105,944.0 | 157,739.0 | 241,392.0 | 208,351.0 | 189,185.0 | 226,565.6 | 271,332.1 | 324,943.9 | 389,148.8 | 466,039.7 |
| Revenue Growth, % | 0 | 48.89 | 53.03 | -13.69 | -9.2 | 19.76 | 19.76 | 19.76 | 19.76 | 19.76 |
| EBITDA | 14,543.0 | 32,549.0 | 59,467.0 | 43,503.0 | 27,983.0 | 42,896.9 | 51,372.8 | 61,523.5 | 73,679.7 | 88,237.9 |
| EBITDA, % | 13.73 | 20.63 | 24.64 | 20.88 | 14.79 | 18.93 | 18.93 | 18.93 | 18.93 | 18.93 |
| Depreciation | 14,889.0 | 14,805.0 | 14,318.0 | 15,928.0 | 16,622.0 | 20,754.2 | 24,855.0 | 29,766.0 | 35,647.4 | 42,690.9 |
| Depreciation, % | 14.05 | 9.39 | 5.93 | 7.64 | 8.79 | 9.16 | 9.16 | 9.16 | 9.16 | 9.16 |
| EBIT | -346.0 | 17,744.0 | 45,149.0 | 27,575.0 | 11,361.0 | 22,142.7 | 26,517.9 | 31,757.5 | 38,032.4 | 45,547.1 |
| EBIT, % | -0.32659 | 11.25 | 18.7 | 13.23 | 6.01 | 9.77 | 9.77 | 9.77 | 9.77 | 9.77 |
| Total Cash | 29,527.0 | 30,961.0 | 29,773.0 | 28,591.0 | 34,525.0 | 41,599.3 | 49,818.8 | 59,662.4 | 71,450.9 | 85,568.7 |
| Total Cash, percent | .0 | .0 | .0 | .0 | .0 | .0 | .0 | .0 | .0 | .0 |
| Account Receivables | 13,265.0 | 22,711.0 | 28,883.0 | 26,018.0 | 26,185.0 | 29,549.7 | 35,388.4 | 42,380.7 | 50,754.6 | 60,783.1 |
| Account Receivables, % | 12.52 | 14.4 | 11.97 | 12.49 | 13.84 | 13.04 | 13.04 | 13.04 | 13.04 | 13.04 |
| Inventories | 16,873.0 | 23,711.0 | 28,081.0 | 22,819.0 | 23,232.0 | 29,826.6 | 35,720.0 | 42,777.8 | 51,230.1 | 61,352.5 |
| Inventories, % | 15.93 | 15.03 | 11.63 | 10.95 | 12.28 | 13.16 | 13.16 | 13.16 | 13.16 | 13.16 |
| Accounts Payable | 23,157.0 | 37,327.0 | 47,210.0 | 42,406.0 | 58,411.0 | 52,702.4 | 63,115.7 | 75,586.6 | 90,521.6 | 108,407.5 |
| Accounts Payable, % | 21.86 | 23.66 | 19.56 | 20.35 | 30.88 | 23.26 | 23.26 | 23.26 | 23.26 | 23.26 |
| Capital Expenditure | -12,306.0 | -10,887.0 | -12,069.0 | -14,285.0 | -15,297.0 | -17,427.1 | -20,870.4 | -24,994.2 | -29,932.7 | -35,847.0 |
| Capital Expenditure, % | -11.62 | -6.9 | -5 | -6.86 | -8.09 | -7.69 | -7.69 | -7.69 | -7.69 | -7.69 |
| Tax Rate, % | 92.04 | 92.04 | 92.04 | 92.04 | 92.04 | 92.04 | 92.04 | 92.04 | 92.04 | 92.04 |
| EBITAT | -288.2 | 8,815.5 | -3,977.1 | 17,694.0 | 903.9 | 9,082.7 | 10,877.3 | 13,026.5 | 15,600.4 | 18,682.8 |
| Depreciation | ||||||||||
| Changes in Account Receivables | ||||||||||
| Changes in Inventories | ||||||||||
| Changes in Accounts Payable | ||||||||||
| Capital Expenditure | ||||||||||
| UFCF | -4,686.2 | 10,619.5 | -2,387.1 | 22,660.0 | 17,653.9 | -3,258.1 | 13,543.1 | 16,219.1 | 19,423.8 | 23,261.7 |
| WACC, % | 5.48 | 5.25 | 4.91 | 5.35 | 4.96 | 5.19 | 5.19 | 5.19 | 5.19 | 5.19 |
| PV UFCF | ||||||||||
| SUM PV UFCF | 56,998.7 | |||||||||
| Long Term Growth Rate, % | 2.00 | |||||||||
| Free cash flow (T + 1) | 23,727 | |||||||||
| Terminal Value | 743,171 | |||||||||
| Present Terminal Value | 576,981 | |||||||||
| Enterprise Value | 633,980 | |||||||||
| Net Debt | 37,187 | |||||||||
| Equity Value | 596,793 | |||||||||
| Diluted Shares Outstanding, MM | 16,817 | |||||||||
| Equity Value Per Share | 35.49 |
What You Will Get
- Real BP Financial Data: Pre-filled with BP p.l.c.'s historical and projected data for precise analysis.
- Fully Editable Template: Modify key inputs like revenue growth, WACC, and EBITDA % with ease.
- Automatic Calculations: See BP's intrinsic value update instantly based on your changes.
- Professional Valuation Tool: Designed for investors, analysts, and consultants seeking accurate DCF results.
- User-Friendly Design: Simple structure and clear instructions for all experience levels.
Key Features
- Comprehensive DCF Calculator: Features detailed unlevered and levered DCF valuation models tailored for BP p.l.c. (BP).
- WACC Calculator: Pre-configured Weighted Average Cost of Capital sheet with adjustable inputs specific to BP p.l.c. (BP).
- Customizable Forecast Assumptions: Adjust growth rates, capital expenditures, and discount rates to fit BP p.l.c. (BP) projections.
- Integrated Financial Ratios: Evaluate profitability, leverage, and efficiency ratios for BP p.l.c. (BP).
- Interactive Dashboard and Charts: Visual representations summarize key valuation metrics for straightforward analysis of BP p.l.c. (BP).
How It Works
- Step 1: Download the Excel file.
- Step 2: Review pre-entered BP p.l.c. (BP) data (historical and projected).
- Step 3: Adjust key assumptions (yellow cells) based on your analysis.
- Step 4: View automatic recalculations for BP p.l.c. (BP)’s intrinsic value.
- Step 5: Use the outputs for investment decisions or reporting.
Why Choose BP p.l.c. (BP)?
- Innovative Solutions: Benefit from cutting-edge technology and sustainable energy practices.
- Global Reach: Access a vast network of resources and expertise across multiple regions.
- Commitment to Sustainability: Invest in a company dedicated to reducing carbon emissions and promoting renewable energy.
- Experienced Leadership: Rely on a team of industry leaders with a proven track record in energy management.
- Strong Financial Performance: Trust in a company with a history of delivering solid returns to its shareholders.
Who Should Use BP p.l.c. (BP)?
- Investors: Leverage insights from a leading energy company to make informed investment choices.
- Energy Analysts: Access comprehensive data to enhance your market analysis and forecasts.
- Consultants: Utilize BP's resources for tailored client strategies and presentations.
- Energy Enthusiasts: Expand your knowledge of the energy sector through BP's innovative practices and sustainability efforts.
- Educators and Students: Employ BP's case studies as a valuable resource in energy and business education.
What the Template Contains
- Historical Data: Includes BP p.l.c. (BP)’s past financials and baseline forecasts.
- DCF and Levered DCF Models: Detailed templates to calculate BP p.l.c. (BP)’s intrinsic value.
- WACC Sheet: Pre-built calculations for Weighted Average Cost of Capital.
- Editable Inputs: Modify key drivers like growth rates, EBITDA %, and CAPEX assumptions.
- Quarterly and Annual Statements: A complete breakdown of BP p.l.c. (BP)’s financials.
- Interactive Dashboard: Visualize valuation results and projections dynamically.
Disclaimer
All information, articles, and product details provided on this website are for general informational and educational purposes only. We do not claim any ownership over, nor do we intend to infringe upon, any trademarks, copyrights, logos, brand names, or other intellectual property mentioned or depicted on this site. Such intellectual property remains the property of its respective owners, and any references here are made solely for identification or informational purposes, without implying any affiliation, endorsement, or partnership.
We make no representations or warranties, express or implied, regarding the accuracy, completeness, or suitability of any content or products presented. Nothing on this website should be construed as legal, tax, investment, financial, medical, or other professional advice. In addition, no part of this site—including articles or product references—constitutes a solicitation, recommendation, endorsement, advertisement, or offer to buy or sell any securities, franchises, or other financial instruments, particularly in jurisdictions where such activity would be unlawful.
All content is of a general nature and may not address the specific circumstances of any individual or entity. It is not a substitute for professional advice or services. Any actions you take based on the information provided here are strictly at your own risk. You accept full responsibility for any decisions or outcomes arising from your use of this website and agree to release us from any liability in connection with your use of, or reliance upon, the content or products found herein.