
|
تقييم بنك برينستون (BPRN) DCF |
Fully Editable: Tailor To Your Needs In Excel Or Sheets
Professional Design: Trusted, Industry-Standard Templates
Investor-Approved Valuation Models
MAC/PC Compatible, Fully Unlocked
No Expertise Is Needed; Easy To Follow
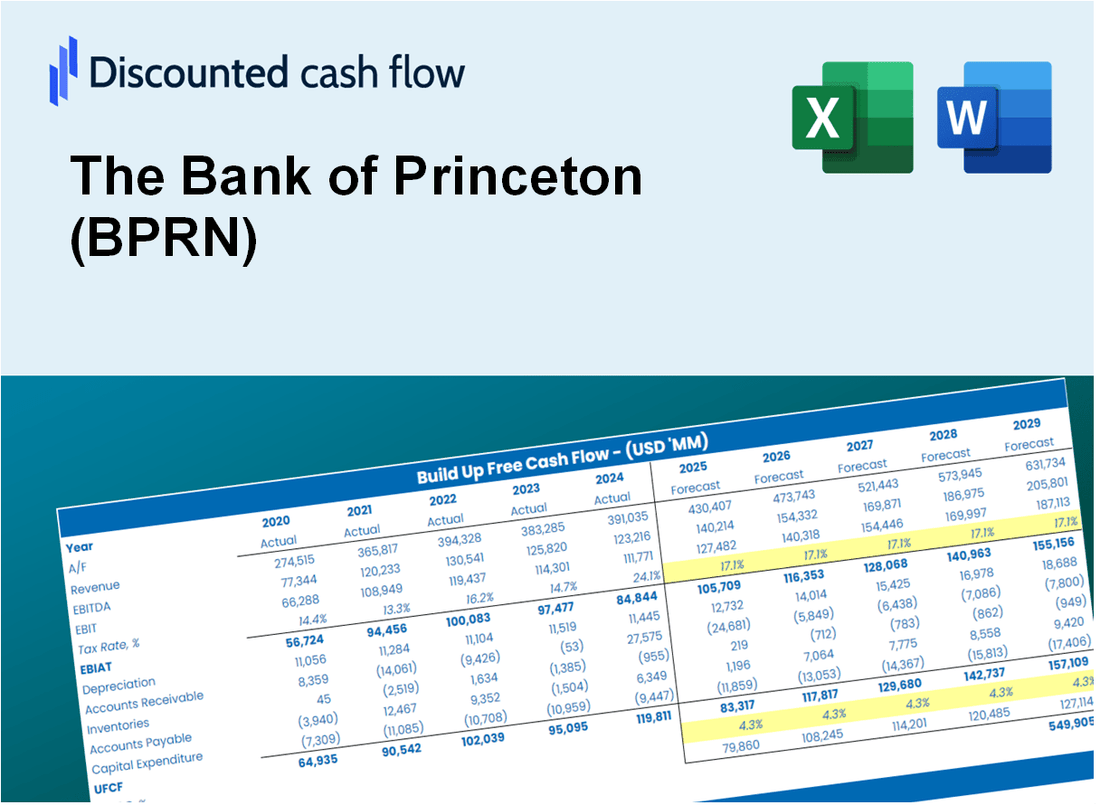
The Bank of Princeton (BPRN) Bundle
تقييم التوقعات المالية لبنك برينستون (BPRN) مثل خبير! توفر حاسبة DCF (BPRN) هذه البيانات المالية المليئة مسبقًا جنبًا إلى جنب مع المرونة لتعديل نمو الإيرادات ، و WACC ، والهوامش ، وغيرها من الافتراضات الحاسمة التي تتماشى مع توقعاتك.
Discounted Cash Flow (DCF) - (USD MM)
| Year | AY1 2020 |
AY2 2021 |
AY3 2022 |
AY4 2023 |
AY5 2024 |
FY1 2025 |
FY2 2026 |
FY3 2027 |
FY4 2028 |
FY5 2029 |
|---|---|---|---|---|---|---|---|---|---|---|
| Revenue | 66.5 | 73.9 | 78.9 | 105.4 | 131.1 | 156.0 | 185.6 | 220.8 | 262.6 | 312.5 |
| Revenue Growth, % | 0 | 11.22 | 6.77 | 33.51 | 24.38 | 18.97 | 18.97 | 18.97 | 18.97 | 18.97 |
| EBITDA | 19.2 | 31.1 | 36.1 | 32.3 | 15.1 | 49.6 | 59.0 | 70.1 | 83.4 | 99.3 |
| EBITDA, % | 28.84 | 42.11 | 45.73 | 30.66 | 11.52 | 31.77 | 31.77 | 31.77 | 31.77 | 31.77 |
| Depreciation | 1.9 | 2.0 | 2.1 | 2.0 | 2.3 | 3.6 | 4.3 | 5.2 | 6.1 | 7.3 |
| Depreciation, % | 2.84 | 2.64 | 2.6 | 1.88 | 1.74 | 2.34 | 2.34 | 2.34 | 2.34 | 2.34 |
| EBIT | 17.3 | 29.2 | 34.1 | 30.3 | 12.8 | 45.9 | 54.6 | 65.0 | 77.3 | 92.0 |
| EBIT, % | 26.01 | 39.48 | 43.13 | 28.78 | 9.78 | 29.43 | 29.43 | 29.43 | 29.43 | 29.43 |
| Total Cash | 143.1 | 113.2 | 106.6 | 125.9 | 227.6 | 156.0 | 185.6 | 220.8 | 262.6 | 312.5 |
| Total Cash, percent | .0 | .0 | .0 | .0 | .0 | .0 | .0 | .0 | .0 | .0 |
| Account Receivables | 4.9 | 4.2 | 4.8 | 6.1 | 8.0 | 9.7 | 11.5 | 13.7 | 16.3 | 19.3 |
| Account Receivables, % | 7.36 | 5.7 | 6.02 | 5.78 | 6.08 | 6.19 | 6.19 | 6.19 | 6.19 | 6.19 |
| Inventories | .0 | .0 | .0 | .0 | .0 | .0 | .0 | .0 | .0 | .0 |
| Inventories, % | 0 | 0 | 0 | 0 | 0 | 0 | 0 | 0 | 0 | 0 |
| Accounts Payable | 2.5 | 1.0 | 1.0 | 9.2 | 15.4 | 8.4 | 10.0 | 11.9 | 14.1 | 16.8 |
| Accounts Payable, % | 3.72 | 1.41 | 1.3 | 8.69 | 11.75 | 5.38 | 5.38 | 5.38 | 5.38 | 5.38 |
| Capital Expenditure | -3.1 | -1.2 | -.6 | -1.7 | -1.5 | -3.1 | -3.6 | -4.3 | -5.2 | -6.1 |
| Capital Expenditure, % | -4.66 | -1.61 | -0.76889 | -1.62 | -1.16 | -1.97 | -1.97 | -1.97 | -1.97 | -1.97 |
| Tax Rate, % | 20.08 | 20.08 | 20.08 | 20.08 | 20.08 | 20.08 | 20.08 | 20.08 | 20.08 | 20.08 |
| EBITAT | 13.8 | 22.5 | 26.5 | 25.8 | 10.2 | 36.7 | 43.6 | 51.9 | 61.8 | 73.5 |
| Depreciation | ||||||||||
| Changes in Account Receivables | ||||||||||
| Changes in Inventories | ||||||||||
| Changes in Accounts Payable | ||||||||||
| Capital Expenditure | ||||||||||
| UFCF | 10.2 | 22.5 | 27.4 | 32.8 | 15.4 | 28.6 | 44.1 | 52.5 | 62.4 | 74.3 |
| WACC, % | 24.05 | 23.4 | 23.58 | 25.23 | 24.07 | 24.06 | 24.06 | 24.06 | 24.06 | 24.06 |
| PV UFCF | ||||||||||
| SUM PV UFCF | 130.8 | |||||||||
| Long Term Growth Rate, % | 2.00 | |||||||||
| Free cash flow (T + 1) | 76 | |||||||||
| Terminal Value | 343 | |||||||||
| Present Terminal Value | 117 | |||||||||
| Enterprise Value | 248 | |||||||||
| Net Debt | -11 | |||||||||
| Equity Value | 258 | |||||||||
| Diluted Shares Outstanding, MM | 7 | |||||||||
| Equity Value Per Share | 39.01 |
What You Will Receive
- Authentic BPRN Data: Preloaded financials – encompassing everything from revenue to EBIT – based on actual and projected figures.
- Comprehensive Customization: Modify all essential parameters (yellow cells) such as WACC, growth %, and tax rates.
- Immediate Valuation Adjustments: Automatic recalculations to evaluate the effects of changes on BPRN's fair value.
- Flexible Excel Template: Designed for quick edits, scenario analysis, and detailed forecasts.
- Efficient and Precise: Avoid the hassle of building models from the ground up while ensuring accuracy and adaptability.
Key Features
- Comprehensive Financial Analysis Tool: Offers detailed models for assessing both unlevered and levered DCF valuations for The Bank of Princeton (BPRN).
- WACC Calculator: Features a pre-configured Weighted Average Cost of Capital sheet with adjustable parameters tailored for BPRN.
- Customizable Forecast Inputs: Easily adjust growth projections, capital expenditures, and discount rates specific to The Bank of Princeton (BPRN).
- Integrated Financial Ratios: Evaluate profitability, leverage, and efficiency metrics relevant to The Bank of Princeton (BPRN).
- Interactive Dashboard and Visualizations: Provides graphical summaries of essential valuation indicators for straightforward analysis.
How It Works
- Step 1: Download the Excel file for The Bank of Princeton (BPRN).
- Step 2: Review the pre-filled financial data and forecasts for The Bank of Princeton (BPRN).
- Step 3: Adjust key inputs such as loan growth, cost of capital, and regulatory rates (highlighted cells).
- Step 4: Observe the DCF model update in real-time as you modify your assumptions.
- Step 5: Evaluate the outputs and leverage the results for your investment strategies.
Why Choose The Bank of Princeton (BPRN)?
- Reliability: Trusted financial services backed by a strong reputation.
- Personalized Service: Tailored banking solutions to meet individual customer needs.
- Convenience: Access to a wide range of banking products and services in one place.
- Community Focused: Committed to supporting local businesses and initiatives.
- Innovative Technology: User-friendly digital platforms for seamless banking experiences.
Who Should Use This Product?
- Individual Investors: Make informed decisions about buying or selling Bank of Princeton (BPRN) stock.
- Financial Analysts: Enhance valuation processes with readily available financial models for Bank of Princeton (BPRN).
- Consultants: Provide clients with accurate and timely valuation insights regarding Bank of Princeton (BPRN).
- Business Owners: Gain insights into how banks like Bank of Princeton (BPRN) are valued to inform your own business strategies.
- Finance Students: Explore valuation techniques using real-world data and case studies related to Bank of Princeton (BPRN).
What the Template Contains
- Preloaded BPRN Data: Historical and projected financial data, including revenue, net interest income, and operating expenses.
- DCF and WACC Models: Professional-grade sheets for calculating intrinsic value and Weighted Average Cost of Capital.
- Editable Inputs: Yellow-highlighted cells for adjusting loan growth, deposit rates, and discount rates.
- Financial Statements: Comprehensive annual and quarterly financials for deeper analysis.
- Key Ratios: Profitability, liquidity, and capital adequacy ratios to evaluate performance.
- Dashboard and Charts: Visual summaries of valuation outcomes and assumptions.
Disclaimer
All information, articles, and product details provided on this website are for general informational and educational purposes only. We do not claim any ownership over, nor do we intend to infringe upon, any trademarks, copyrights, logos, brand names, or other intellectual property mentioned or depicted on this site. Such intellectual property remains the property of its respective owners, and any references here are made solely for identification or informational purposes, without implying any affiliation, endorsement, or partnership.
We make no representations or warranties, express or implied, regarding the accuracy, completeness, or suitability of any content or products presented. Nothing on this website should be construed as legal, tax, investment, financial, medical, or other professional advice. In addition, no part of this site—including articles or product references—constitutes a solicitation, recommendation, endorsement, advertisement, or offer to buy or sell any securities, franchises, or other financial instruments, particularly in jurisdictions where such activity would be unlawful.
All content is of a general nature and may not address the specific circumstances of any individual or entity. It is not a substitute for professional advice or services. Any actions you take based on the information provided here are strictly at your own risk. You accept full responsibility for any decisions or outcomes arising from your use of this website and agree to release us from any liability in connection with your use of, or reliance upon, the content or products found herein.