
|
تقييم Burford Capital Limited (BUR) DCF |
Fully Editable: Tailor To Your Needs In Excel Or Sheets
Professional Design: Trusted, Industry-Standard Templates
Investor-Approved Valuation Models
MAC/PC Compatible, Fully Unlocked
No Expertise Is Needed; Easy To Follow
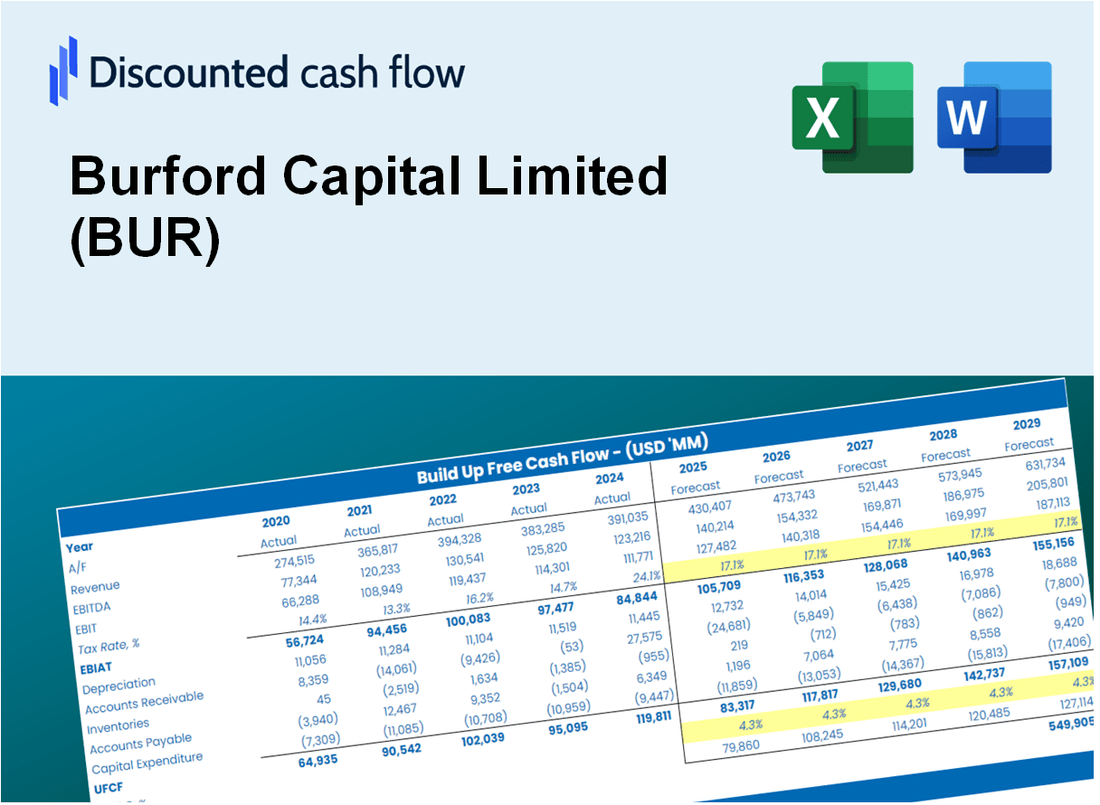
Burford Capital Limited (BUR) Bundle
تم تصميم حاسبة DCF الخاصة بنا (BUR) DCF الخاصة بنا ، بتقييم تقييم Burford Capital Limited باستخدام المعلومات المالية الحديثة ويوفر مرونة كاملة لتعديل جميع المعلمات الأساسية للتوقعات المحسنة.
Discounted Cash Flow (DCF) - (USD MM)
| Year | AY1 2020 |
AY2 2021 |
AY3 2022 |
AY4 2023 |
AY5 2024 |
FY1 2025 |
FY2 2026 |
FY3 2027 |
FY4 2028 |
FY5 2029 |
|---|---|---|---|---|---|---|---|---|---|---|
| Revenue | 416.5 | 142.2 | 355.9 | 1,418.9 | 621.1 | 742.0 | 886.6 | 1,059.3 | 1,265.6 | 1,512.1 |
| Revenue Growth, % | 0 | -65.86 | 150.28 | 298.68 | -56.23 | 19.48 | 19.48 | 19.48 | 19.48 | 19.48 |
| EBITDA | 287.9 | 7.9 | 149.1 | 1,080.0 | 333.5 | 365.6 | 436.9 | 522.0 | 623.6 | 745.1 |
| EBITDA, % | 69.13 | 5.53 | 41.9 | 76.11 | 53.7 | 49.28 | 49.28 | 49.28 | 49.28 | 49.28 |
| Depreciation | 14.1 | 4.2 | 5.7 | 17.8 | .0 | 13.6 | 16.3 | 19.5 | 23.3 | 27.8 |
| Depreciation, % | 3.38 | 2.95 | 1.61 | 1.25 | 0 | 1.84 | 1.84 | 1.84 | 1.84 | 1.84 |
| EBIT | 273.9 | 3.7 | 143.4 | 1,062.2 | 333.5 | 352.0 | 420.6 | 502.5 | 600.4 | 717.3 |
| EBIT, % | 65.76 | 2.58 | 40.28 | 74.86 | 53.7 | 47.44 | 47.44 | 47.44 | 47.44 | 47.44 |
| Total Cash | 423.7 | 237.1 | 141.6 | 290.1 | 618.0 | 533.9 | 637.9 | 762.1 | 910.6 | 1,087.9 |
| Total Cash, percent | .0 | .0 | .0 | .0 | .0 | .0 | .0 | .0 | .0 | .0 |
| Account Receivables | 35.5 | 139.9 | 181.3 | 377.5 | 264.3 | 336.9 | 402.5 | 480.9 | 574.6 | 686.6 |
| Account Receivables, % | 8.51 | 98.41 | 50.93 | 26.61 | 42.55 | 45.4 | 45.4 | 45.4 | 45.4 | 45.4 |
| Inventories | -31.9 | .0 | .0 | .0 | .0 | -11.4 | -13.6 | -16.3 | -19.4 | -23.2 |
| Inventories, % | -7.67 | 0 | 0 | 0 | 0 | -1.53 | -1.53 | -1.53 | -1.53 | -1.53 |
| Accounts Payable | 12.6 | 18.3 | 22.1 | 45.3 | 15.9 | 41.3 | 49.4 | 59.0 | 70.5 | 84.2 |
| Accounts Payable, % | 3.02 | 12.87 | 6.21 | 3.19 | 2.56 | 5.57 | 5.57 | 5.57 | 5.57 | 5.57 |
| Capital Expenditure | -.5 | -.4 | -.5 | -4.2 | -.9 | -1.4 | -1.7 | -2.0 | -2.4 | -2.9 |
| Capital Expenditure, % | -0.11368 | -0.26359 | -0.1504 | -0.29771 | -0.13997 | -0.19307 | -0.19307 | -0.19307 | -0.19307 | -0.19307 |
| Tax Rate, % | 42.24 | 42.24 | 42.24 | 42.24 | 42.24 | 42.24 | 42.24 | 42.24 | 42.24 | 42.24 |
| EBITAT | 188.1 | -37.8 | 40.1 | 878.4 | 192.6 | 166.9 | 199.4 | 238.3 | 284.7 | 340.2 |
| Depreciation | ||||||||||
| Changes in Account Receivables | ||||||||||
| Changes in Inventories | ||||||||||
| Changes in Accounts Payable | ||||||||||
| Capital Expenditure | ||||||||||
| UFCF | 210.7 | -164.7 | 7.8 | 718.8 | 275.7 | 143.3 | 158.7 | 189.6 | 226.5 | 270.6 |
| WACC, % | 6.56 | 3.76 | 4.9 | 7.13 | 6.12 | 5.7 | 5.7 | 5.7 | 5.7 | 5.7 |
| PV UFCF | ||||||||||
| SUM PV UFCF | 824.9 | |||||||||
| Long Term Growth Rate, % | 2.00 | |||||||||
| Free cash flow (T + 1) | 276 | |||||||||
| Terminal Value | 7,471 | |||||||||
| Present Terminal Value | 5,663 | |||||||||
| Enterprise Value | 6,488 | |||||||||
| Net Debt | 1,721 | |||||||||
| Equity Value | 4,767 | |||||||||
| Diluted Shares Outstanding, MM | 219 | |||||||||
| Equity Value Per Share | 21.73 |
What You Will Get
- Comprehensive BUR Financials: Access historical and projected data for precise valuation.
- Customizable Inputs: Adjust WACC, tax rates, revenue growth, and capital expenditures as needed.
- Real-Time Calculations: Intrinsic value and NPV are updated automatically.
- Scenario Analysis: Evaluate various scenarios to assess Burford Capital's future outlook.
- User-Friendly Design: Designed for professionals while remaining easy to navigate for newcomers.
Key Features
- Comprehensive Litigation Finance Models: Offers in-depth financial models tailored for legal funding scenarios.
- Risk Assessment Tools: Built-in tools to evaluate and manage investment risks associated with litigation.
- Customizable Investment Parameters: Adjust various inputs such as case duration, expected returns, and funding amounts.
- Performance Metrics Dashboard: Monitor key performance indicators and financial health of Burford Capital Limited (BUR).
- Visual Analytics and Reporting: Generate visual reports to simplify complex data for stakeholders.
How It Works
- Step 1: Download the prebuilt Excel template featuring Burford Capital Limited’s (BUR) data.
- Step 2: Navigate through the pre-filled sheets to familiarize yourself with the essential metrics.
- Step 3: Update forecasts and assumptions in the editable yellow cells (WACC, growth, margins).
- Step 4: Instantly view the recalculated results, including Burford Capital Limited’s (BUR) intrinsic value.
- Step 5: Make informed investment decisions or create reports based on the outputs.
Why Choose Burford Capital Limited (BUR) Calculator?
- All-in-One Solution: Combines DCF, WACC, and financial ratio analyses for comprehensive evaluation.
- Flexible Parameters: Modify highlighted cells to explore different financial scenarios.
- In-Depth Analysis: Automatically computes Burford's intrinsic value and Net Present Value.
- Integrated Data: Features both historical and projected data for reliable analysis.
- Expert-Level Tool: Perfect for financial analysts, investors, and business advisors.
Who Should Use This Product?
- Investors: Evaluate Burford Capital's (BUR) valuation before making investment decisions.
- CFOs and Financial Analysts: Optimize valuation methodologies and assess financial forecasts.
- Startup Founders: Understand the valuation strategies of established firms like Burford Capital.
- Consultants: Create comprehensive valuation reports for clients based on Burford Capital's data.
- Students and Educators: Utilize real-world examples to explore and teach valuation principles.
What the Template Contains
- Preloaded BUR Data: Historical and projected financial data, including revenue, EBIT, and capital expenditures.
- DCF and WACC Models: Professional-grade sheets for calculating intrinsic value and Weighted Average Cost of Capital.
- Editable Inputs: Yellow-highlighted cells for adjusting revenue growth, tax rates, and discount rates.
- Financial Statements: Comprehensive annual and quarterly financials for deeper analysis.
- Key Ratios: Profitability, leverage, and efficiency ratios to evaluate performance.
- Dashboard and Charts: Visual summaries of valuation outcomes and assumptions.
Disclaimer
All information, articles, and product details provided on this website are for general informational and educational purposes only. We do not claim any ownership over, nor do we intend to infringe upon, any trademarks, copyrights, logos, brand names, or other intellectual property mentioned or depicted on this site. Such intellectual property remains the property of its respective owners, and any references here are made solely for identification or informational purposes, without implying any affiliation, endorsement, or partnership.
We make no representations or warranties, express or implied, regarding the accuracy, completeness, or suitability of any content or products presented. Nothing on this website should be construed as legal, tax, investment, financial, medical, or other professional advice. In addition, no part of this site—including articles or product references—constitutes a solicitation, recommendation, endorsement, advertisement, or offer to buy or sell any securities, franchises, or other financial instruments, particularly in jurisdictions where such activity would be unlawful.
All content is of a general nature and may not address the specific circumstances of any individual or entity. It is not a substitute for professional advice or services. Any actions you take based on the information provided here are strictly at your own risk. You accept full responsibility for any decisions or outcomes arising from your use of this website and agree to release us from any liability in connection with your use of, or reliance upon, the content or products found herein.