
|
Conagra Brands ، Inc. (CAG) تقييم DCF |
Fully Editable: Tailor To Your Needs In Excel Or Sheets
Professional Design: Trusted, Industry-Standard Templates
Investor-Approved Valuation Models
MAC/PC Compatible, Fully Unlocked
No Expertise Is Needed; Easy To Follow
Conagra Brands, Inc. (CAG) Bundle
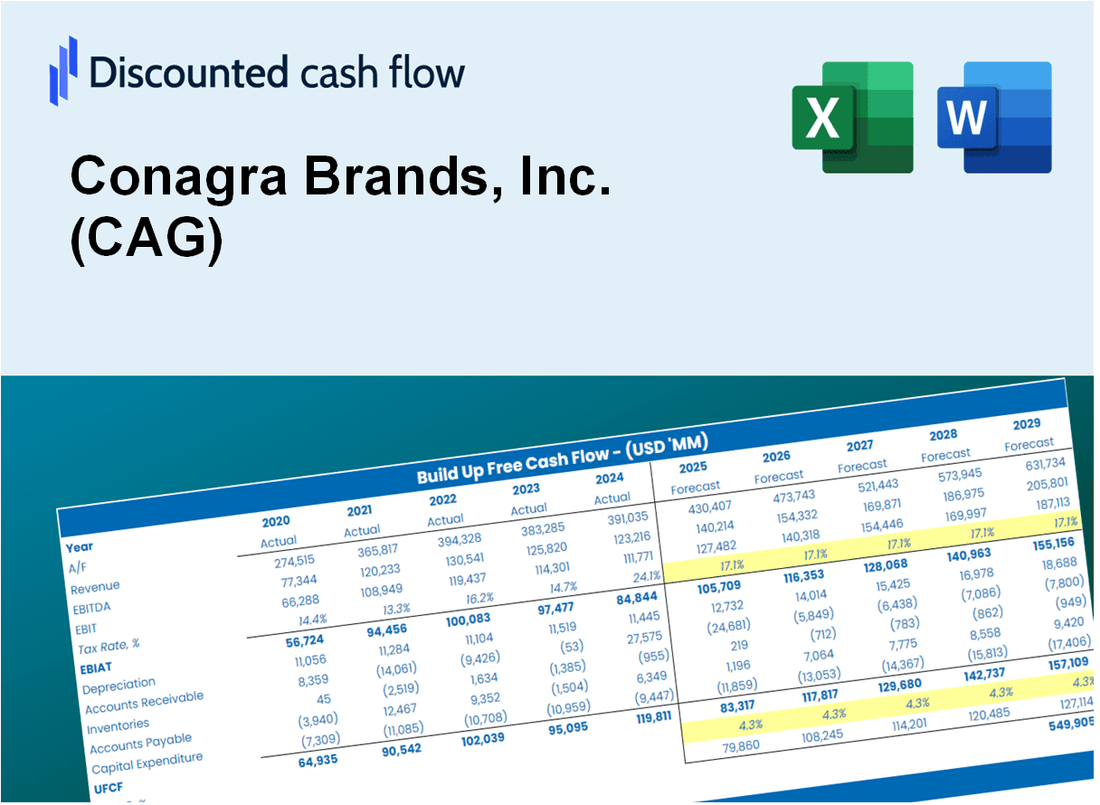
قم بتقييم شركة Conagra Brands، Inc. (CAG) التوقعات المالية مثل الخبير! توفر لك حاسبة DCF (CAG) هذه بيانات مالية مملوءة مسبقًا ومرونة لتعديل نمو الإيرادات و WACC والهوامش والافتراضات الأساسية الأخرى لتتماشى مع توقعاتك.
Discounted Cash Flow (DCF) - (USD MM)
| Year | AY1 2021 |
AY2 2022 |
AY3 2023 |
AY4 2024 |
AY5 2025 |
FY1 2026 |
FY2 2027 |
FY3 2028 |
FY4 2029 |
FY5 2030 |
|---|---|---|---|---|---|---|---|---|---|---|
| Revenue | 11,184.7 | 11,535.9 | 12,277.0 | 12,050.9 | 11,612.8 | 11,731.5 | 11,851.3 | 11,972.4 | 12,094.8 | 12,218.4 |
| Revenue Growth, % | 0 | 3.14 | 6.42 | -1.84 | -3.64 | 1.02 | 1.02 | 1.02 | 1.02 | 1.02 |
| EBITDA | 2,217.1 | 1,787.7 | 1,470.0 | 1,443.8 | 1,962.9 | 1,787.3 | 1,805.6 | 1,824.0 | 1,842.7 | 1,861.5 |
| EBITDA, % | 19.82 | 15.5 | 11.97 | 11.98 | 16.9 | 15.24 | 15.24 | 15.24 | 15.24 | 15.24 |
| Depreciation | 387.7 | 375.4 | 369.9 | 400.9 | 390.2 | 385.3 | 389.2 | 393.2 | 397.2 | 401.3 |
| Depreciation, % | 3.47 | 3.25 | 3.01 | 3.33 | 3.36 | 3.28 | 3.28 | 3.28 | 3.28 | 3.28 |
| EBIT | 1,829.4 | 1,412.3 | 1,100.1 | 1,042.9 | 1,572.7 | 1,402.1 | 1,416.4 | 1,430.9 | 1,445.5 | 1,460.3 |
| EBIT, % | 16.36 | 12.24 | 8.96 | 8.65 | 13.54 | 11.95 | 11.95 | 11.95 | 11.95 | 11.95 |
| Total Cash | 79.2 | 83.3 | 93.3 | 77.7 | 68.0 | 80.3 | 81.1 | 81.9 | 82.7 | 83.6 |
| Total Cash, percent | .0 | .0 | .0 | .0 | .0 | .0 | .0 | .0 | .0 | .0 |
| Account Receivables | 793.9 | 867.4 | 952.8 | 871.8 | 770.0 | 850.4 | 859.1 | 867.8 | 876.7 | 885.7 |
| Account Receivables, % | 7.1 | 7.52 | 7.76 | 7.23 | 6.63 | 7.25 | 7.25 | 7.25 | 7.25 | 7.25 |
| Inventories | 1,709.7 | 1,966.7 | 2,212.2 | 2,083.0 | 2,048.3 | 2,000.8 | 2,021.3 | 2,041.9 | 2,062.8 | 2,083.9 |
| Inventories, % | 15.29 | 17.05 | 18.02 | 17.29 | 17.64 | 17.06 | 17.06 | 17.06 | 17.06 | 17.06 |
| Accounts Payable | 1,655.9 | 1,864.6 | 1,525.5 | 1,493.7 | 1,590.1 | 1,630.2 | 1,646.9 | 1,663.7 | 1,680.7 | 1,697.9 |
| Accounts Payable, % | 14.81 | 16.16 | 12.43 | 12.39 | 13.69 | 13.9 | 13.9 | 13.9 | 13.9 | 13.9 |
| Capital Expenditure | -506.4 | -464.4 | -362.2 | -388.1 | -389.3 | -424.1 | -428.5 | -432.8 | -437.3 | -441.7 |
| Capital Expenditure, % | -4.53 | -4.03 | -2.95 | -3.22 | -3.35 | -3.62 | -3.62 | -3.62 | -3.62 | -3.62 |
| Tax Rate, % | 0.32001 | 0.32001 | 0.32001 | 0.32001 | 0.32001 | 0.32001 | 0.32001 | 0.32001 | 0.32001 | 0.32001 |
| EBITAT | 1,589.6 | 1,064.2 | 833.8 | 593.4 | 1,567.7 | 1,106.6 | 1,117.9 | 1,129.3 | 1,140.8 | 1,152.5 |
| Depreciation | ||||||||||
| Changes in Account Receivables | ||||||||||
| Changes in Inventories | ||||||||||
| Changes in Accounts Payable | ||||||||||
| Capital Expenditure | ||||||||||
| UFCF | 623.2 | 853.4 | 171.5 | 784.6 | 1,801.5 | 1,074.9 | 1,066.1 | 1,077.0 | 1,088.0 | 1,099.2 |
| WACC, % | 4.52 | 4.23 | 4.24 | 3.77 | 4.84 | 4.32 | 4.32 | 4.32 | 4.32 | 4.32 |
| PV UFCF | ||||||||||
| SUM PV UFCF | 4,767.0 | |||||||||
| Long Term Growth Rate, % | 1.00 | |||||||||
| Free cash flow (T + 1) | 1,110 | |||||||||
| Terminal Value | 33,424 | |||||||||
| Present Terminal Value | 27,051 | |||||||||
| Enterprise Value | 31,818 | |||||||||
| Net Debt | 8,243 | |||||||||
| Equity Value | 23,576 | |||||||||
| Diluted Shares Outstanding, MM | 478 | |||||||||
| Equity Value Per Share | 49.29 |
What You Will Get
- Real Conagra Data: Preloaded financials – from revenue to EBIT – based on actual and projected figures for Conagra Brands, Inc. (CAG).
- Full Customization: Adjust all critical parameters (yellow cells) like WACC, growth %, and tax rates to fit your analysis.
- Instant Valuation Updates: Automatic recalculations to assess the impact of changes on Conagra’s fair value.
- Versatile Excel Template: Designed for quick edits, scenario testing, and comprehensive projections.
- Time-Saving and Accurate: Avoid building models from scratch while ensuring precision and flexibility.
Key Features
- Comprehensive CAG Data: Pre-filled with Conagra's historical financials and future projections.
- Fully Customizable Inputs: Modify revenue growth, profit margins, WACC, tax rates, and capital expenditures.
- Dynamic Valuation Model: Automatic updates to Net Present Value (NPV) and intrinsic value based on your adjustments.
- Scenario Testing: Develop multiple forecast scenarios to evaluate various valuation outcomes.
- User-Friendly Design: Intuitive, organized, and suitable for both professionals and newcomers.
How It Works
- Download: Get the pre-built Excel file featuring Conagra Brands, Inc.'s (CAG) financial data.
- Customize: Modify forecasts such as revenue growth, EBITDA %, and WACC to fit your analysis.
- Update Automatically: The intrinsic value and NPV calculations refresh in real-time as you make changes.
- Test Scenarios: Develop various projections and instantly compare their results.
- Make Decisions: Leverage the valuation insights to inform your investment choices.
Why Choose This Calculator for Conagra Brands, Inc. (CAG)?
- Accuracy: Utilizes real Conagra financial data to ensure precise calculations.
- Flexibility: Crafted for users to easily test and adjust inputs as needed.
- Time-Saving: Avoid the complexities of creating a DCF model from the ground up.
- Professional-Grade: Engineered with the same precision and usability expected at the CFO level.
- User-Friendly: Intuitive interface suitable for users without extensive financial modeling skills.
Who Should Use This Product?
- Individual Investors: Gain insights for making informed decisions regarding Conagra Brands, Inc. (CAG) stock transactions.
- Financial Analysts: Enhance valuation accuracy with comprehensive financial models tailored for Conagra Brands, Inc. (CAG).
- Consultants: Provide clients with expert valuation analyses of Conagra Brands, Inc. (CAG) efficiently and effectively.
- Business Owners: Learn about the valuation methods of large food companies like Conagra Brands, Inc. (CAG) to inform your business strategies.
- Finance Students: Explore valuation concepts through practical examples using data from Conagra Brands, Inc. (CAG).
What the Template Contains
- Preloaded CAG Data: Historical and projected financial data, including revenue, EBIT, and capital expenditures.
- DCF and WACC Models: Professional-grade sheets for calculating intrinsic value and Weighted Average Cost of Capital.
- Editable Inputs: Yellow-highlighted cells for adjusting revenue growth, tax rates, and discount rates.
- Financial Statements: Comprehensive annual and quarterly financials for deeper analysis.
- Key Ratios: Profitability, leverage, and efficiency ratios to evaluate performance.
- Dashboard and Charts: Visual summaries of valuation outcomes and assumptions.
Disclaimer
All information, articles, and product details provided on this website are for general informational and educational purposes only. We do not claim any ownership over, nor do we intend to infringe upon, any trademarks, copyrights, logos, brand names, or other intellectual property mentioned or depicted on this site. Such intellectual property remains the property of its respective owners, and any references here are made solely for identification or informational purposes, without implying any affiliation, endorsement, or partnership.
We make no representations or warranties, express or implied, regarding the accuracy, completeness, or suitability of any content or products presented. Nothing on this website should be construed as legal, tax, investment, financial, medical, or other professional advice. In addition, no part of this site—including articles or product references—constitutes a solicitation, recommendation, endorsement, advertisement, or offer to buy or sell any securities, franchises, or other financial instruments, particularly in jurisdictions where such activity would be unlawful.
All content is of a general nature and may not address the specific circumstances of any individual or entity. It is not a substitute for professional advice or services. Any actions you take based on the information provided here are strictly at your own risk. You accept full responsibility for any decisions or outcomes arising from your use of this website and agree to release us from any liability in connection with your use of, or reliance upon, the content or products found herein.