
|
Cass Information Systems ، Inc. (CASS) DCF تقييم |
Fully Editable: Tailor To Your Needs In Excel Or Sheets
Professional Design: Trusted, Industry-Standard Templates
Investor-Approved Valuation Models
MAC/PC Compatible, Fully Unlocked
No Expertise Is Needed; Easy To Follow
Cass Information Systems, Inc. (CASS) Bundle
سواء كنت مستثمرًا أو محللًا ، فإن حاسبة DCF (CASS) هذه هي أداة الانتقال إلى التقييم الدقيق. محملة بالبيانات الحقيقية من Cass Information Systems ، Inc. ، يمكنك ضبط التوقعات ورؤية التأثيرات على الفور.
What You Will Get
- Editable Excel Template: A fully customizable Excel-based DCF Calculator featuring pre-filled real CASS financials.
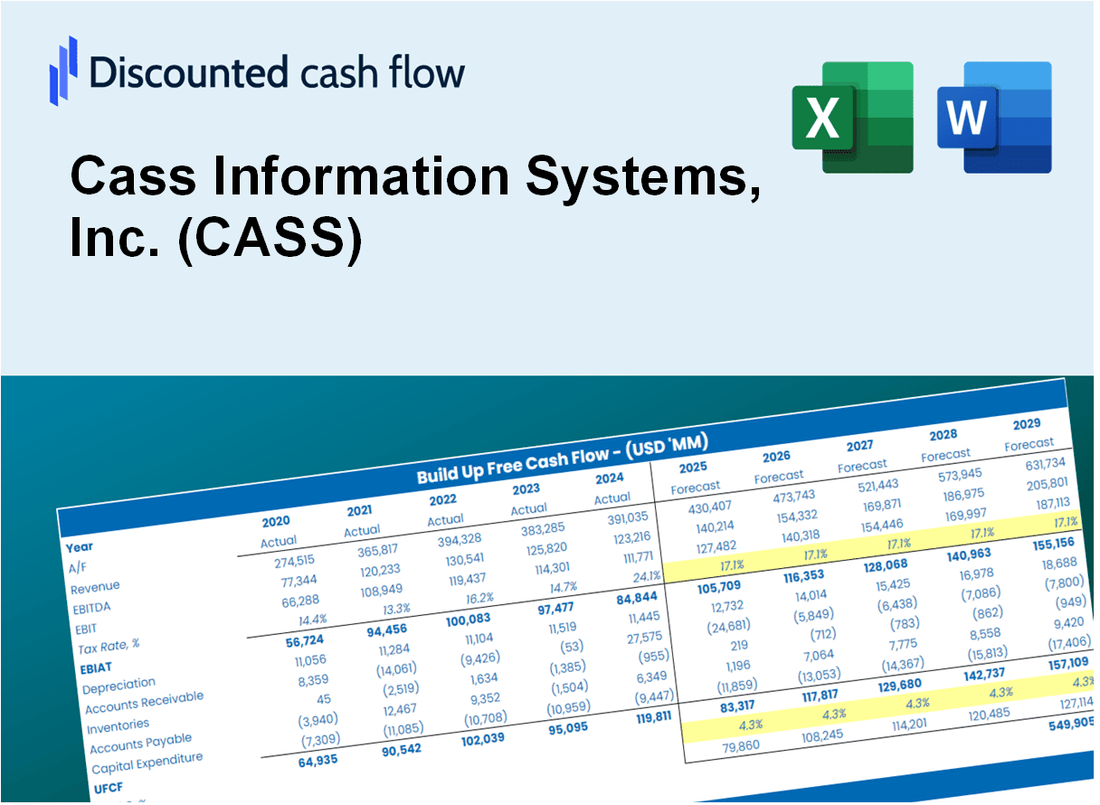
- Real-World Data: Historical data and forward-looking estimates (as highlighted in the yellow cells).
- Forecast Flexibility: Modify forecast assumptions such as revenue growth, EBITDA %, and WACC.
- Automatic Calculations: Instantly observe the effects of your inputs on Cass Information Systems’ valuation.
- Professional Tool: Designed for investors, CFOs, consultants, and financial analysts.
- User-Friendly Design: Organized for clarity and ease of use, complete with step-by-step instructions.
Key Features
- Pre-Loaded Data: Cass Information Systems' historical financial statements and pre-filled forecasts.
- Fully Adjustable Inputs: Modify WACC, tax rates, revenue growth, and EBITDA margins as needed.
- Instant Results: View CASS's intrinsic value recalculated in real time.
- Clear Visual Outputs: Dashboard charts present valuation results and essential metrics.
- Built for Accuracy: A professional tool designed for analysts, investors, and finance experts.
How It Works
- Step 1: Download the prebuilt Excel template featuring Cass Information Systems, Inc.'s (CASS) data.
- Step 2: Review the pre-filled sheets and familiarize yourself with the essential metrics.
- Step 3: Modify forecasts and assumptions in the editable yellow cells (WACC, growth, margins).
- Step 4: Instantly see the recalibrated results, including Cass Information Systems, Inc.'s (CASS) intrinsic value.
- Step 5: Make well-informed investment decisions or create reports based on the outputs.
Why Choose This Calculator for Cass Information Systems, Inc. (CASS)?
- All-in-One Solution: Combines DCF, WACC, and financial ratio analyses tailored for CASS.
- Flexible Inputs: Modify the yellow-highlighted cells to explore different financial scenarios.
- In-Depth Analysis: Automatically computes Cass Information Systems' intrinsic value and Net Present Value.
- Preloaded Information: Access to historical and projected data for accurate analysis.
- High-Quality Standards: Designed for financial analysts, investors, and business consultants focused on CASS.
Who Should Use This Product?
- Investors: Accurately assess the fair value of Cass Information Systems, Inc. (CASS) prior to making investment choices.
- CFOs: Utilize a professional-grade DCF model for comprehensive financial reporting and analysis.
- Consultants: Easily customize the template for valuation reports tailored to clients' needs.
- Entrepreneurs: Acquire knowledge on financial modeling practices employed by leading firms.
- Educators: Implement it as a resource for teaching valuation techniques and methodologies.
What the Template Contains
- Preloaded CASS Data: Historical and projected financial data, including revenue, EBIT, and capital expenditures.
- DCF and WACC Models: Professional-grade sheets for calculating intrinsic value and Weighted Average Cost of Capital.
- Editable Inputs: Yellow-highlighted cells for adjusting revenue growth, tax rates, and discount rates.
- Financial Statements: Comprehensive annual and quarterly financials for deeper analysis.
- Key Ratios: Profitability, leverage, and efficiency ratios to evaluate performance.
- Dashboard and Charts: Visual summaries of valuation outcomes and assumptions.
Disclaimer
All information, articles, and product details provided on this website are for general informational and educational purposes only. We do not claim any ownership over, nor do we intend to infringe upon, any trademarks, copyrights, logos, brand names, or other intellectual property mentioned or depicted on this site. Such intellectual property remains the property of its respective owners, and any references here are made solely for identification or informational purposes, without implying any affiliation, endorsement, or partnership.
We make no representations or warranties, express or implied, regarding the accuracy, completeness, or suitability of any content or products presented. Nothing on this website should be construed as legal, tax, investment, financial, medical, or other professional advice. In addition, no part of this site—including articles or product references—constitutes a solicitation, recommendation, endorsement, advertisement, or offer to buy or sell any securities, franchises, or other financial instruments, particularly in jurisdictions where such activity would be unlawful.
All content is of a general nature and may not address the specific circumstances of any individual or entity. It is not a substitute for professional advice or services. Any actions you take based on the information provided here are strictly at your own risk. You accept full responsibility for any decisions or outcomes arising from your use of this website and agree to release us from any liability in connection with your use of, or reliance upon, the content or products found herein.