
|
Cryo-Cell International ، Inc. (CCEL) DCF تقييم |
Fully Editable: Tailor To Your Needs In Excel Or Sheets
Professional Design: Trusted, Industry-Standard Templates
Investor-Approved Valuation Models
MAC/PC Compatible, Fully Unlocked
No Expertise Is Needed; Easy To Follow
Cryo-Cell International, Inc. (CCEL) Bundle
وفر الوقت وتحسين الدقة مع حاسبة (CCEL) DCF! باستخدام بيانات حقيقية من Cryo-Cell International ، Inc. والافتراضات القابلة للتخصيص ، فإن هذه الأداة تمكنك من التنبؤ وتحليل وقيمة الخلايا بالتبريد مثل المستثمر المحنك.
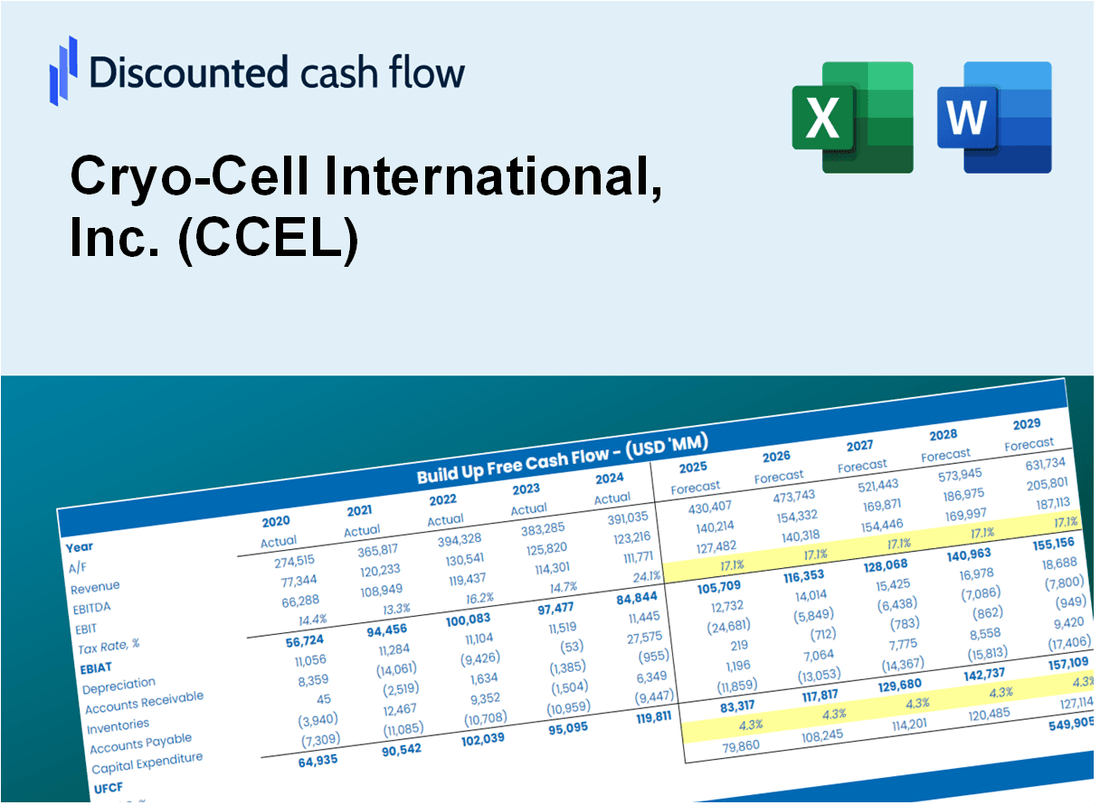
Discounted Cash Flow (DCF) - (USD MM)
| Year | AY1 2020 |
AY2 2021 |
AY3 2022 |
AY4 2023 |
AY5 2024 |
FY1 2025 |
FY2 2026 |
FY3 2027 |
FY4 2028 |
FY5 2029 |
|---|---|---|---|---|---|---|---|---|---|---|
| Revenue | 31.1 | 28.9 | 30.3 | 31.3 | 32.0 | 32.2 | 32.5 | 32.7 | 33.0 | 33.3 |
| Revenue Growth, % | 0 | -7.26 | 5.03 | 3.32 | 2.05 | 0.78267 | 0.78267 | 0.78267 | 0.78267 | 0.78267 |
| EBITDA | 7.2 | 5.3 | 6.7 | -10.4 | 1.4 | 2.2 | 2.3 | 2.3 | 2.3 | 2.3 |
| EBITDA, % | 23.18 | 18.41 | 21.92 | -33.24 | 4.45 | 6.94 | 6.94 | 6.94 | 6.94 | 6.94 |
| Depreciation | .6 | 1.3 | 1.8 | 1.7 | .5 | 1.3 | 1.3 | 1.3 | 1.3 | 1.3 |
| Depreciation, % | 2.04 | 4.59 | 5.96 | 5.46 | 1.51 | 3.91 | 3.91 | 3.91 | 3.91 | 3.91 |
| EBIT | 6.6 | 4.0 | 4.8 | -12.1 | .9 | 1.0 | 1.0 | 1.0 | 1.0 | 1.0 |
| EBIT, % | 21.14 | 13.81 | 15.96 | -38.69 | 2.94 | 3.03 | 3.03 | 3.03 | 3.03 | 3.03 |
| Total Cash | 10.4 | 8.3 | 1.7 | 1.0 | 3.5 | 5.3 | 5.3 | 5.4 | 5.4 | 5.5 |
| Total Cash, percent | .0 | .0 | .0 | .0 | .0 | .0 | .0 | .0 | .0 | .0 |
| Account Receivables | 6.3 | 5.3 | 6.0 | 6.6 | 7.3 | 6.6 | 6.6 | 6.7 | 6.7 | 6.8 |
| Account Receivables, % | 20.3 | 18.19 | 19.92 | 20.98 | 22.85 | 20.45 | 20.45 | 20.45 | 20.45 | 20.45 |
| Inventories | .9 | .9 | .9 | .8 | .7 | .9 | .9 | .9 | .9 | .9 |
| Inventories, % | 2.98 | 3.19 | 2.81 | 2.45 | 2.06 | 2.7 | 2.7 | 2.7 | 2.7 | 2.7 |
| Accounts Payable | 1.0 | 1.5 | 1.6 | 3.2 | 1.9 | 1.9 | 1.9 | 1.9 | 1.9 | 2.0 |
| Accounts Payable, % | 3.07 | 5.16 | 5.29 | 10.13 | 5.88 | 5.91 | 5.91 | 5.91 | 5.91 | 5.91 |
| Capital Expenditure | -.4 | -7.0 | -17.2 | -7.6 | -2.4 | -7.3 | -7.4 | -7.5 | -7.5 | -7.6 |
| Capital Expenditure, % | -1.44 | -24.07 | -56.59 | -24.37 | -7.51 | -22.8 | -22.8 | -22.8 | -22.8 | -22.8 |
| Tax Rate, % | 85.66 | 85.66 | 85.66 | 85.66 | 85.66 | 85.66 | 85.66 | 85.66 | 85.66 | 85.66 |
| EBITAT | 4.7 | 3.2 | 4.0 | -8.6 | .1 | .6 | .6 | .6 | .6 | .6 |
| Depreciation | ||||||||||
| Changes in Account Receivables | ||||||||||
| Changes in Inventories | ||||||||||
| Changes in Accounts Payable | ||||||||||
| Capital Expenditure | ||||||||||
| UFCF | -1.4 | -.8 | -11.9 | -13.4 | -3.7 | -4.9 | -5.5 | -5.6 | -5.6 | -5.7 |
| WACC, % | 7.79 | 8.1 | 8.25 | 7.76 | 5.49 | 7.48 | 7.48 | 7.48 | 7.48 | 7.48 |
| PV UFCF | ||||||||||
| SUM PV UFCF | -22.1 | |||||||||
| Long Term Growth Rate, % | 2.00 | |||||||||
| Free cash flow (T + 1) | -6 | |||||||||
| Terminal Value | -106 | |||||||||
| Present Terminal Value | -74 | |||||||||
| Enterprise Value | -96 | |||||||||
| Net Debt | 12 | |||||||||
| Equity Value | -108 | |||||||||
| Diluted Shares Outstanding, MM | 8 | |||||||||
| Equity Value Per Share | -13.17 |
What You Will Receive
- Customizable Excel Template: A fully editable Excel-based DCF Calculator featuring pre-filled financial data for Cryo-Cell International, Inc. (CCEL).
- Accurate Data: Historical figures and future projections (highlighted in the yellow cells).
- Assumption Flexibility: Modify forecast variables such as revenue growth, EBITDA %, and WACC.
- Instant Calculations: Quickly observe how your inputs affect the valuation of Cryo-Cell International, Inc. (CCEL).
- Professional Resource: Designed for investors, CFOs, consultants, and financial analysts.
- Intuitive Layout: Organized for clarity and ease of navigation, complete with step-by-step guidance.
Key Features
- Comprehensive CCEL Data: Pre-loaded with Cryo-Cell International’s historical performance metrics and future forecasts.
- Customizable Assumptions: Modify growth rates, profit margins, discount rates, tax implications, and capital investments.
- Interactive Valuation Framework: Instant recalculations of Net Present Value (NPV) and intrinsic worth based on your parameters.
- Scenario Analysis: Develop various forecasting scenarios to evaluate different valuation possibilities.
- Intuitive User Interface: Clean, organized layout suitable for both experienced professionals and newcomers.
How It Works
- Download the Template: Gain immediate access to the Excel-based CCEL DCF Calculator.
- Input Your Assumptions: Modify the yellow-highlighted cells for growth rates, WACC, margins, and additional parameters.
- Instant Calculations: The model automatically recalculates Cryo-Cell International’s intrinsic value.
- Test Scenarios: Explore various assumptions to assess potential changes in valuation.
- Analyze and Decide: Utilize the outcomes to inform your investment or financial strategies.
Why Choose This Calculator for Cryo-Cell International, Inc. (CCEL)?
- Accurate Data: Utilizes real Cryo-Cell financials for dependable valuation outcomes.
- Customizable: Tailor essential parameters such as growth rates, WACC, and tax rates to align with your forecasts.
- Time-Saving: Pre-configured calculations save you the hassle of starting from square one.
- Professional-Grade Tool: Crafted for investors, analysts, and consultants in the biotech sector.
- User-Friendly: Easy-to-navigate design and comprehensive instructions cater to users of all experience levels.
Who Should Use This Product?
- Investors: Evaluate Cryo-Cell International’s performance before making investment decisions.
- CFOs and Financial Analysts: Enhance financial assessments and validate forecasts.
- Healthcare Entrepreneurs: Understand the valuation methods of leading companies like Cryo-Cell.
- Consultants: Provide detailed valuation analyses for healthcare clients.
- Students and Educators: Utilize current industry data to teach and learn valuation strategies.
What the Template Contains
- Preloaded CCEL Data: Historical and projected financial data, including revenue, EBIT, and capital expenditures.
- DCF and WACC Models: Professional-grade sheets for calculating intrinsic value and Weighted Average Cost of Capital.
- Editable Inputs: Yellow-highlighted cells for adjusting revenue growth, tax rates, and discount rates.
- Financial Statements: Comprehensive annual and quarterly financials for deeper analysis.
- Key Ratios: Profitability, leverage, and efficiency ratios to evaluate performance.
- Dashboard and Charts: Visual summaries of valuation outcomes and assumptions.
Disclaimer
All information, articles, and product details provided on this website are for general informational and educational purposes only. We do not claim any ownership over, nor do we intend to infringe upon, any trademarks, copyrights, logos, brand names, or other intellectual property mentioned or depicted on this site. Such intellectual property remains the property of its respective owners, and any references here are made solely for identification or informational purposes, without implying any affiliation, endorsement, or partnership.
We make no representations or warranties, express or implied, regarding the accuracy, completeness, or suitability of any content or products presented. Nothing on this website should be construed as legal, tax, investment, financial, medical, or other professional advice. In addition, no part of this site—including articles or product references—constitutes a solicitation, recommendation, endorsement, advertisement, or offer to buy or sell any securities, franchises, or other financial instruments, particularly in jurisdictions where such activity would be unlawful.
All content is of a general nature and may not address the specific circumstances of any individual or entity. It is not a substitute for professional advice or services. Any actions you take based on the information provided here are strictly at your own risk. You accept full responsibility for any decisions or outcomes arising from your use of this website and agree to release us from any liability in connection with your use of, or reliance upon, the content or products found herein.