
|
Concord Medical Services Holdings Limited (CCM) DCF |
Fully Editable: Tailor To Your Needs In Excel Or Sheets
Professional Design: Trusted, Industry-Standard Templates
Investor-Approved Valuation Models
MAC/PC Compatible, Fully Unlocked
No Expertise Is Needed; Easy To Follow
Concord Medical Services Holdings Limited (CCM) Bundle
اكتشف القيمة الحقيقية لشركة Concord Medical Services Holdings Limited (CCM) باستخدام حاسبة DCF المتقدمة! ضبط الافتراضات الحرجة، واستكشاف السيناريوهات المختلفة، وتقييم آثار التغييرات على تقييم Concord Medical Services - كل ذلك ضمن نموذج Excel واحد.
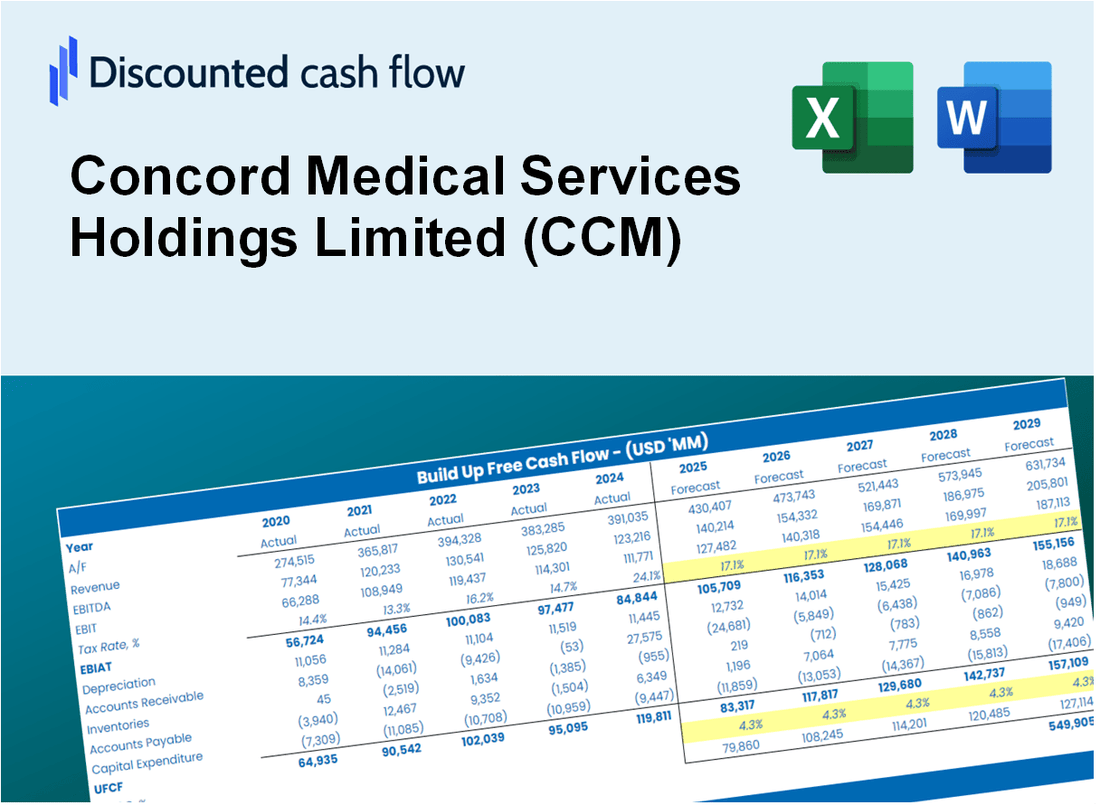
Discounted Cash Flow (DCF) - (USD MM)
| Year | AY1 2020 |
AY2 2021 |
AY3 2022 |
AY4 2023 |
AY5 2024 |
FY1 2025 |
FY2 2026 |
FY3 2027 |
FY4 2028 |
FY5 2029 |
|---|---|---|---|---|---|---|---|---|---|---|
| Revenue | 31.3 | 68.3 | 66.4 | 75.5 | 54.0 | 65.1 | 78.5 | 94.7 | 114.3 | 137.8 |
| Revenue Growth, % | 0 | 117.76 | -2.79 | 13.84 | -28.55 | 20.62 | 20.62 | 20.62 | 20.62 | 20.62 |
| EBITDA | -33.3 | -51.1 | -56.5 | -48.4 | -48.6 | -53.9 | -65.0 | -78.4 | -94.6 | -114.1 |
| EBITDA, % | -106.14 | -74.92 | -85.12 | -64.04 | -90.02 | -82.82 | -82.82 | -82.82 | -82.82 | -82.82 |
| Depreciation | 10.0 | 13.3 | 17.3 | 16.7 | 18.4 | 17.4 | 21.0 | 25.3 | 30.5 | 36.8 |
| Depreciation, % | 31.74 | 19.45 | 26.09 | 22.11 | 34.06 | 26.69 | 26.69 | 26.69 | 26.69 | 26.69 |
| EBIT | -43.2 | -64.4 | -73.8 | -65.1 | -67.0 | -62.6 | -75.5 | -91.0 | -109.8 | -132.5 |
| EBIT, % | -137.89 | -94.38 | -111.22 | -86.15 | -124.07 | -96.11 | -96.11 | -96.11 | -96.11 | -96.11 |
| Total Cash | 47.0 | 22.1 | 22.2 | 8.2 | 49.3 | 34.9 | 42.1 | 50.8 | 61.3 | 73.9 |
| Total Cash, percent | .0 | .0 | .0 | .0 | .0 | .0 | .0 | .0 | .0 | .0 |
| Account Receivables | 26.4 | 53.8 | 18.3 | 10.3 | 7.2 | 28.4 | 34.2 | 41.3 | 49.8 | 60.0 |
| Account Receivables, % | 84.37 | 78.87 | 27.59 | 13.68 | 13.33 | 43.57 | 43.57 | 43.57 | 43.57 | 43.57 |
| Inventories | 3.0 | 5.4 | 11.9 | 5.7 | 4.7 | 6.7 | 8.1 | 9.8 | 11.8 | 14.3 |
| Inventories, % | 9.69 | 7.84 | 17.97 | 7.51 | 8.71 | 10.34 | 10.34 | 10.34 | 10.34 | 10.34 |
| Accounts Payable | 2.6 | 14.4 | 20.6 | 18.2 | 28.0 | 17.8 | 21.4 | 25.9 | 31.2 | 37.6 |
| Accounts Payable, % | 8.35 | 21.11 | 31.09 | 24.05 | 51.93 | 27.31 | 27.31 | 27.31 | 27.31 | 27.31 |
| Capital Expenditure | -70.9 | -106.9 | -53.9 | -16.3 | -57.7 | -52.4 | -63.3 | -76.3 | -92.1 | -111.0 |
| Capital Expenditure, % | -226.31 | -156.62 | -81.29 | -21.53 | -107 | -80.56 | -80.56 | -80.56 | -80.56 | -80.56 |
| Tax Rate, % | 53.96 | 53.96 | 53.96 | 53.96 | 53.96 | 53.96 | 53.96 | 53.96 | 53.96 | 53.96 |
| EBITAT | -30.3 | -33.0 | -43.0 | -34.9 | -30.8 | -35.0 | -42.2 | -50.9 | -61.4 | -74.0 |
| Depreciation | ||||||||||
| Changes in Account Receivables | ||||||||||
| Changes in Inventories | ||||||||||
| Changes in Accounts Payable | ||||||||||
| Capital Expenditure | ||||||||||
| UFCF | -118.2 | -144.6 | -44.5 | -22.7 | -56.2 | -103.5 | -88.0 | -106.2 | -128.1 | -154.5 |
| WACC, % | 3.45 | 2.52 | 2.87 | 2.63 | 2.26 | 2.75 | 2.75 | 2.75 | 2.75 | 2.75 |
| PV UFCF | ||||||||||
| SUM PV UFCF | -531.9 | |||||||||
| Long Term Growth Rate, % | 2.00 | |||||||||
| Free cash flow (T + 1) | -158 | |||||||||
| Terminal Value | -21,115 | |||||||||
| Present Terminal Value | -18,440 | |||||||||
| Enterprise Value | -18,972 | |||||||||
| Net Debt | 522 | |||||||||
| Equity Value | -19,494 | |||||||||
| Diluted Shares Outstanding, MM | 0 | |||||||||
| Equity Value Per Share | -4,016,856.42 |
What You Will Receive
- Customizable Excel Template: A fully adaptable Excel-based DCF Calculator featuring pre-filled financial data for Concord Medical Services Holdings Limited (CCM).
- Authentic Financial Data: Access to historical performance data and projected estimates (highlighted in the yellow cells).
- Flexible Forecasting: Modify key assumptions such as revenue growth, EBITDA margin, and WACC.
- Instant Calculations: Quickly observe how your inputs affect the valuation of Concord Medical Services Holdings Limited (CCM).
- Professional Resource: Designed for investors, CFOs, consultants, and financial analysts.
- Intuitive Layout: Organized for simplicity and ease of navigation, complemented by step-by-step guidance.
Key Features
- Comprehensive Financial Data: Gain insights with reliable historical figures and future forecasts for Concord Medical Services Holdings Limited (CCM).
- Adjustable Forecast Parameters: Modify highlighted fields such as WACC, growth rates, and profit margins to suit your analysis.
- Real-Time Calculations: Enjoy automatic recalculations for DCF, Net Present Value (NPV), and cash flow assessments.
- Interactive Dashboard: Utilize user-friendly graphs and summaries to effectively present your valuation findings.
- Designed for All Skill Levels: A straightforward layout tailored for investors, CFOs, and consultants alike.
How It Works
- Download the Template: Gain immediate access to the Excel-based CCM DCF Calculator.
- Input Your Assumptions: Modify the yellow-highlighted cells for growth rates, WACC, margins, and other variables.
- Instant Calculations: The model will automatically refresh to show Concord Medical's intrinsic value.
- Test Scenarios: Experiment with various assumptions to assess potential changes in valuation.
- Analyze and Decide: Leverage the results to inform your investment or financial analysis.
Why Choose Concord Medical Services Holdings Limited (CCM)?
- Expertise in Healthcare: Benefit from our extensive experience in the medical services sector.
- Innovative Solutions: Access cutting-edge technology and methodologies for enhanced patient care.
- Comprehensive Services: A wide range of medical services tailored to meet diverse healthcare needs.
- Commitment to Quality: Our focus on quality ensures reliable and effective healthcare solutions.
- Proven Track Record: Trusted by healthcare professionals for our dedication to excellence and results.
Who Should Use This Product?
- Healthcare Students: Understand valuation methods and apply them to real-world data.
- Researchers: Utilize advanced models in your studies or publications related to healthcare.
- Investors: Validate your investment strategies and evaluate the valuation metrics for Concord Medical Services Holdings Limited (CCM).
- Market Analysts: Enhance your analysis with a pre-configured, adaptable DCF model tailored for healthcare companies.
- Entrepreneurs: Learn how major healthcare firms like Concord Medical Services Holdings Limited (CCM) are evaluated in the market.
What the Template Contains
- Pre-Filled Data: Includes Concord Medical Services Holdings Limited's historical financials and forecasts.
- Discounted Cash Flow Model: Editable DCF valuation model with automatic calculations.
- Weighted Average Cost of Capital (WACC): A dedicated sheet for calculating WACC based on custom inputs.
- Key Financial Ratios: Analyze Concord Medical Services Holdings Limited's profitability, efficiency, and leverage.
- Customizable Inputs: Edit revenue growth, margins, and tax rates with ease.
- Clear Dashboard: Charts and tables summarizing key valuation results.
Disclaimer
All information, articles, and product details provided on this website are for general informational and educational purposes only. We do not claim any ownership over, nor do we intend to infringe upon, any trademarks, copyrights, logos, brand names, or other intellectual property mentioned or depicted on this site. Such intellectual property remains the property of its respective owners, and any references here are made solely for identification or informational purposes, without implying any affiliation, endorsement, or partnership.
We make no representations or warranties, express or implied, regarding the accuracy, completeness, or suitability of any content or products presented. Nothing on this website should be construed as legal, tax, investment, financial, medical, or other professional advice. In addition, no part of this site—including articles or product references—constitutes a solicitation, recommendation, endorsement, advertisement, or offer to buy or sell any securities, franchises, or other financial instruments, particularly in jurisdictions where such activity would be unlawful.
All content is of a general nature and may not address the specific circumstances of any individual or entity. It is not a substitute for professional advice or services. Any actions you take based on the information provided here are strictly at your own risk. You accept full responsibility for any decisions or outcomes arising from your use of this website and agree to release us from any liability in connection with your use of, or reliance upon, the content or products found herein.