
|
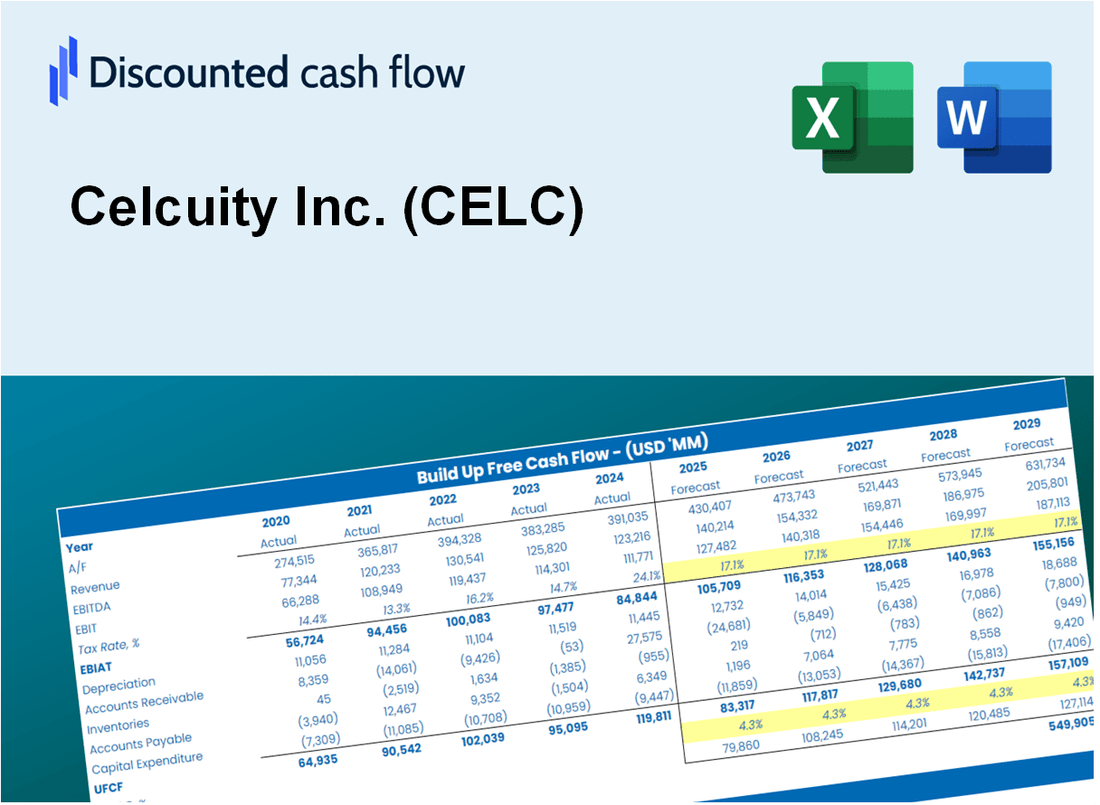
Celcuity Inc. (CELC) DCF تقييم |
Fully Editable: Tailor To Your Needs In Excel Or Sheets
Professional Design: Trusted, Industry-Standard Templates
Investor-Approved Valuation Models
MAC/PC Compatible, Fully Unlocked
No Expertise Is Needed; Easy To Follow
Celcuity Inc. (CELC) Bundle
تبحث لحساب القيمة الجوهرية لشركة Celcuity Inc.؟ يدمج حاسبة CELC DCF الخاصة بنا بيانات العالم الحقيقي مع ميزات تخصيص واسعة ، مما يتيح لك ضبط التوقعات وتعزيز استراتيجيات الاستثمار الخاصة بك.
What You Will Receive
- Pre-Populated Financial Model: Celcuity Inc.’s actual data facilitates accurate DCF valuation.
- Comprehensive Forecast Control: Modify revenue growth, profit margins, WACC, and other essential metrics.
- Real-Time Calculations: Automatic updates provide immediate feedback as you adjust inputs.
- Professional-Grade Template: A polished Excel file crafted for high-quality valuation.
- Flexible and Reusable: Designed for adaptability, allowing for repeated use in detailed forecasting.
Key Features
- Comprehensive CELC Data: Pre-loaded with Celcuity Inc.'s historical performance and future projections.
- Customizable Assumptions: Modify growth rates, profit margins, discount rates, tax assumptions, and capital investments.
- Interactive Valuation Framework: Real-time updates to Net Present Value (NPV) and intrinsic value based on your adjustments.
- Scenario Analysis: Develop various forecasting scenarios to evaluate different valuation possibilities.
- Intuitive User Interface: Designed for ease of use, catering to both industry professionals and newcomers.
How It Works
- Download: Obtain the ready-to-use Excel file featuring Celcuity Inc.'s (CELC) financial metrics.
- Customize: Tailor forecasts, including revenue projections, EBITDA %, and WACC.
- Update Automatically: The intrinsic value and NPV calculations refresh in real-time.
- Test Scenarios: Generate multiple projections and evaluate results immediately.
- Make Decisions: Utilize the valuation insights to inform your investment approach.
Why Choose This Calculator for Celcuity Inc. (CELC)?
- Designed for Experts: A sophisticated tool utilized by analysts, CFOs, and industry consultants.
- Comprehensive Data: Celcuity’s historical and projected financials preloaded for precise analysis.
- Flexible Scenario Analysis: Easily simulate various forecasts and assumptions.
- Insightful Outputs: Automatically computes intrinsic value, NPV, and essential metrics.
- User-Friendly: Step-by-step guidance to help you navigate the process effortlessly.
Who Should Use This Product?
- Investors: Evaluate Celcuity Inc.’s (CELC) market performance before making investment decisions.
- CFOs and Financial Analysts: Optimize valuation methodologies and assess financial forecasts for Celcuity Inc. (CELC).
- Startup Founders: Understand how emerging biotech companies like Celcuity Inc. (CELC) are valued in the market.
- Consultants: Create detailed valuation analyses and reports for clients focusing on Celcuity Inc. (CELC).
- Students and Educators: Utilize real-time data from Celcuity Inc. (CELC) to enhance learning in valuation practices.
What the Template Contains
- Pre-Filled DCF Model: Celcuity Inc.’s (CELC) financial data preloaded for immediate use.
- WACC Calculator: Detailed calculations for Weighted Average Cost of Capital.
- Financial Ratios: Evaluate Celcuity Inc.’s (CELC) profitability, leverage, and efficiency.
- Editable Inputs: Change assumptions such as growth, margins, and CAPEX to fit your scenarios.
- Financial Statements: Annual and quarterly reports to support detailed analysis.
- Interactive Dashboard: Easily visualize key valuation metrics and results.
Disclaimer
All information, articles, and product details provided on this website are for general informational and educational purposes only. We do not claim any ownership over, nor do we intend to infringe upon, any trademarks, copyrights, logos, brand names, or other intellectual property mentioned or depicted on this site. Such intellectual property remains the property of its respective owners, and any references here are made solely for identification or informational purposes, without implying any affiliation, endorsement, or partnership.
We make no representations or warranties, express or implied, regarding the accuracy, completeness, or suitability of any content or products presented. Nothing on this website should be construed as legal, tax, investment, financial, medical, or other professional advice. In addition, no part of this site—including articles or product references—constitutes a solicitation, recommendation, endorsement, advertisement, or offer to buy or sell any securities, franchises, or other financial instruments, particularly in jurisdictions where such activity would be unlawful.
All content is of a general nature and may not address the specific circumstances of any individual or entity. It is not a substitute for professional advice or services. Any actions you take based on the information provided here are strictly at your own risk. You accept full responsibility for any decisions or outcomes arising from your use of this website and agree to release us from any liability in connection with your use of, or reliance upon, the content or products found herein.