
|
تقييم Carlyle Group Inc. (CG) DCF |
Fully Editable: Tailor To Your Needs In Excel Or Sheets
Professional Design: Trusted, Industry-Standard Templates
Investor-Approved Valuation Models
MAC/PC Compatible, Fully Unlocked
No Expertise Is Needed; Easy To Follow
The Carlyle Group Inc. (CG) Bundle
استكشف المستقبل المالي لشركة Carlyle Group Inc. (CG) مع حاسبة DCF سهلة الاستخدام! أدخل توقعاتك للنمو والهوامش والمصروفات لتحديد القيمة الجوهرية لمجموعة Carlyle Inc. (CG) وتشكيل نهج الاستثمار الخاص بك.
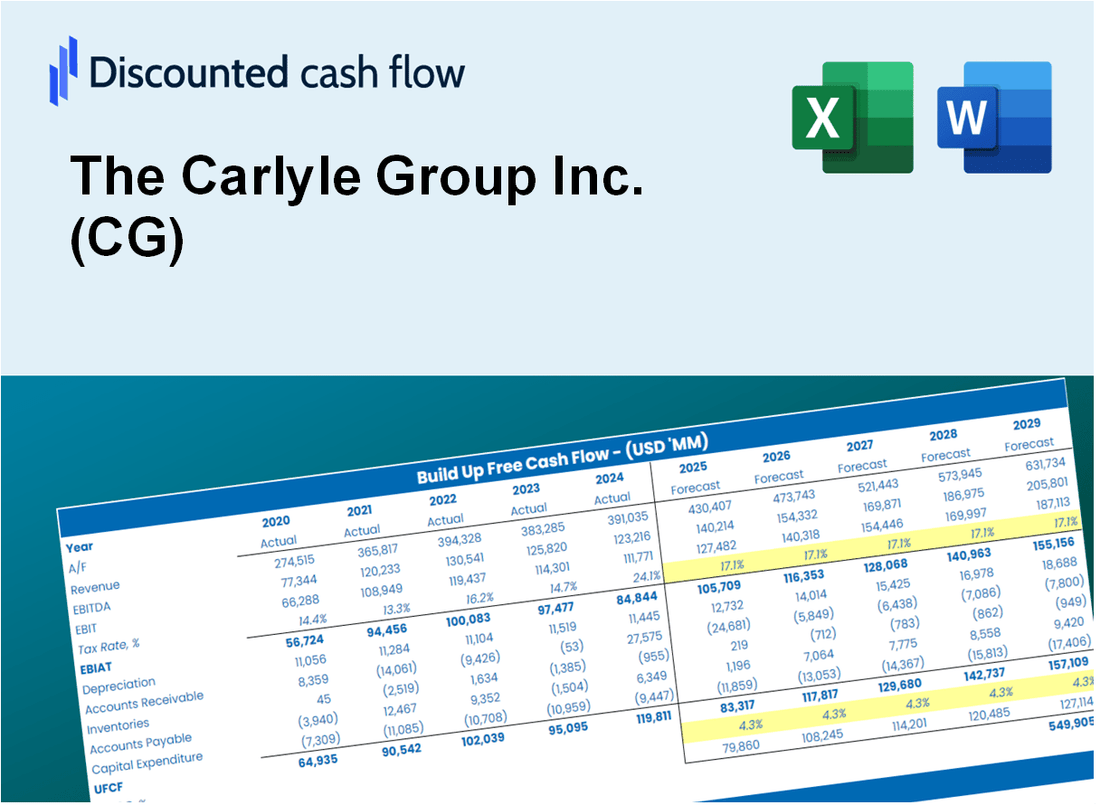
Discounted Cash Flow (DCF) - (USD MM)
| Year | AY1 2020 |
AY2 2021 |
AY3 2022 |
AY4 2023 |
AY5 2024 |
FY1 2025 |
FY2 2026 |
FY3 2027 |
FY4 2028 |
FY5 2029 |
|---|---|---|---|---|---|---|---|---|---|---|
| Revenue | 2,134.2 | 5,823.6 | 3,677.3 | 1,867.1 | 4,088.3 | 5,252.6 | 6,748.6 | 8,670.5 | 11,139.9 | 14,312.4 |
| Revenue Growth, % | 0 | 172.87 | -36.86 | -49.23 | 118.97 | 28.48 | 28.48 | 28.48 | 28.48 | 28.48 |
| EBITDA | 632.1 | 4,079.5 | 1,719.9 | -420.3 | 1,577.8 | 1,707.3 | 2,193.6 | 2,818.3 | 3,620.9 | 4,652.2 |
| EBITDA, % | 29.62 | 70.05 | 46.77 | -22.51 | 38.59 | 32.5 | 32.5 | 32.5 | 32.5 | 32.5 |
| Depreciation | 52.1 | 52.0 | 147.4 | 180.6 | 184.1 | 226.1 | 290.4 | 373.2 | 479.4 | 616.0 |
| Depreciation, % | 2.44 | 0.89292 | 4.01 | 9.67 | 4.5 | 4.3 | 4.3 | 4.3 | 4.3 | 4.3 |
| EBIT | 580.0 | 4,027.5 | 1,572.5 | -600.9 | 1,393.7 | 1,481.3 | 1,903.1 | 2,445.1 | 3,141.5 | 4,036.2 |
| EBIT, % | 27.18 | 69.16 | 42.76 | -32.18 | 34.09 | 28.2 | 28.2 | 28.2 | 28.2 | 28.2 |
| Total Cash | 1,136.2 | 2,617.3 | 1,569.7 | 1,788.1 | 2,096.4 | 3,024.6 | 3,886.0 | 4,992.7 | 6,414.6 | 8,241.5 |
| Total Cash, percent | .0 | .0 | .0 | .0 | .0 | .0 | .0 | .0 | .0 | .0 |
| Account Receivables | 361.6 | 518.4 | 681.3 | 832.6 | 1,042.7 | 1,202.5 | 1,545.0 | 1,985.0 | 2,550.4 | 3,276.7 |
| Account Receivables, % | 16.94 | 8.9 | 18.53 | 44.59 | 25.5 | 22.89 | 22.89 | 22.89 | 22.89 | 22.89 |
| Inventories | .0 | .0 | .0 | .0 | .0 | .0 | .0 | .0 | .0 | .0 |
| Inventories, % | 0 | 0 | 0 | 0 | 0 | 0 | 0 | 0 | 0 | 0 |
| Accounts Payable | 286.3 | 379.7 | 362.5 | .0 | .0 | 313.0 | 402.1 | 516.6 | 663.8 | 852.8 |
| Accounts Payable, % | 13.41 | 6.52 | 9.86 | 0 | 0 | 5.96 | 5.96 | 5.96 | 5.96 | 5.96 |
| Capital Expenditure | -61.2 | -41.4 | -40.6 | -66.6 | -77.7 | -106.6 | -137.0 | -176.0 | -226.1 | -290.5 |
| Capital Expenditure, % | -2.87 | -0.7109 | -1.1 | -3.57 | -1.9 | -2.03 | -2.03 | -2.03 | -2.03 | -2.03 |
| Tax Rate, % | 26.78 | 26.78 | 26.78 | 26.78 | 26.78 | 26.78 | 26.78 | 26.78 | 26.78 | 26.78 |
| EBITAT | 348.2 | 2,974.7 | 1,225.0 | -608.4 | 1,020.4 | 1,140.6 | 1,465.5 | 1,882.8 | 2,419.0 | 3,108.0 |
| Depreciation | ||||||||||
| Changes in Account Receivables | ||||||||||
| Changes in Inventories | ||||||||||
| Changes in Accounts Payable | ||||||||||
| Capital Expenditure | ||||||||||
| UFCF | 263.8 | 2,921.9 | 1,151.7 | -1,008.2 | 916.7 | 1,413.2 | 1,365.6 | 1,754.5 | 2,254.1 | 2,896.1 |
| WACC, % | 10.48 | 10.8 | 10.9 | 11.42 | 10.79 | 10.88 | 10.88 | 10.88 | 10.88 | 10.88 |
| PV UFCF | ||||||||||
| SUM PV UFCF | 6,892.1 | |||||||||
| Long Term Growth Rate, % | 2.00 | |||||||||
| Free cash flow (T + 1) | 2,954 | |||||||||
| Terminal Value | 33,276 | |||||||||
| Present Terminal Value | 19,858 | |||||||||
| Enterprise Value | 26,750 | |||||||||
| Net Debt | 7,400 | |||||||||
| Equity Value | 19,350 | |||||||||
| Diluted Shares Outstanding, MM | 368 | |||||||||
| Equity Value Per Share | 52.58 |
What You Will Receive
- Authentic CG Financial Data: Pre-loaded with The Carlyle Group’s historical and projected figures for detailed analysis.
- Completely Customizable Template: Easily adjust key inputs such as revenue growth, WACC, and EBITDA percentage.
- Instant Calculations: Watch The Carlyle Group’s intrinsic value update in real-time as you make adjustments.
- Expert Valuation Tool: Tailored for investors, analysts, and consultants aiming for precise DCF outcomes.
- Intuitive Design: Straightforward layout and clear guidance suitable for all skill levels.
Key Features
- 🔍 Real-Life CG Financials: Pre-filled historical and projected data for The Carlyle Group Inc. (CG).
- ✏️ Fully Customizable Inputs: Adjust all critical parameters (yellow cells) like WACC, growth %, and tax rates.
- 📊 Professional DCF Valuation: Built-in formulas calculate The Carlyle Group’s intrinsic value using the Discounted Cash Flow method.
- ⚡ Instant Results: Visualize The Carlyle Group’s valuation instantly after making changes.
- Scenario Analysis: Test and compare outcomes for various financial assumptions side-by-side.
How It Works
- 1. Access the Template: Download and open the Excel file featuring The Carlyle Group Inc.'s preloaded data.
- 2. Modify Assumptions: Adjust essential inputs such as growth rates, WACC, and capital expenditures.
- 3. Analyze Results Instantly: The DCF model automatically computes intrinsic value and NPV.
- 4. Explore Scenarios: Evaluate various forecasts to assess different valuation possibilities.
- 5. Present with Assurance: Deliver expert valuation insights to back your strategic decisions.
Why Choose This Calculator for The Carlyle Group Inc. (CG)?
- User-Friendly Interface: Tailored for both novice users and seasoned professionals.
- Customizable Inputs: Adjust parameters easily to suit your financial analysis.
- Real-Time Valuation: Monitor immediate changes to The Carlyle Group’s valuation as you tweak the inputs.
- Preloaded Data: Comes equipped with The Carlyle Group’s actual financial metrics for efficient assessment.
- Relied Upon by Experts: Favored by investors and analysts for making well-informed investment choices.
Who Should Use This Product?
- Investors: Evaluate The Carlyle Group Inc.'s (CG) performance to inform investment decisions.
- CFOs and Financial Analysts: Enhance valuation methodologies and assess financial forecasts.
- Private Equity Professionals: Understand valuation strategies used by leading firms like The Carlyle Group Inc. (CG).
- Consultants: Create comprehensive valuation reports for clients in the investment sector.
- Students and Educators: Utilize current data to teach and learn about valuation practices in finance.
What the Template Contains
- Comprehensive DCF Model: Editable template featuring detailed valuation calculations for The Carlyle Group Inc. (CG).
- Real-World Data: The Carlyle Group’s historical and projected financials preloaded for thorough analysis.
- Customizable Parameters: Adjust WACC, growth rates, and tax assumptions to explore various scenarios.
- Financial Statements: Complete annual and quarterly breakdowns for enhanced insights.
- Key Ratios: Integrated analysis for profitability, efficiency, and leverage metrics.
- Dashboard with Visual Outputs: Charts and tables designed for clear, actionable results.
Disclaimer
All information, articles, and product details provided on this website are for general informational and educational purposes only. We do not claim any ownership over, nor do we intend to infringe upon, any trademarks, copyrights, logos, brand names, or other intellectual property mentioned or depicted on this site. Such intellectual property remains the property of its respective owners, and any references here are made solely for identification or informational purposes, without implying any affiliation, endorsement, or partnership.
We make no representations or warranties, express or implied, regarding the accuracy, completeness, or suitability of any content or products presented. Nothing on this website should be construed as legal, tax, investment, financial, medical, or other professional advice. In addition, no part of this site—including articles or product references—constitutes a solicitation, recommendation, endorsement, advertisement, or offer to buy or sell any securities, franchises, or other financial instruments, particularly in jurisdictions where such activity would be unlawful.
All content is of a general nature and may not address the specific circumstances of any individual or entity. It is not a substitute for professional advice or services. Any actions you take based on the information provided here are strictly at your own risk. You accept full responsibility for any decisions or outcomes arising from your use of this website and agree to release us from any liability in connection with your use of, or reliance upon, the content or products found herein.