
|
كنيسة & Dwight Co. ، Inc. (CHD) تقييم DCF |
Fully Editable: Tailor To Your Needs In Excel Or Sheets
Professional Design: Trusted, Industry-Standard Templates
Investor-Approved Valuation Models
MAC/PC Compatible, Fully Unlocked
No Expertise Is Needed; Easy To Follow
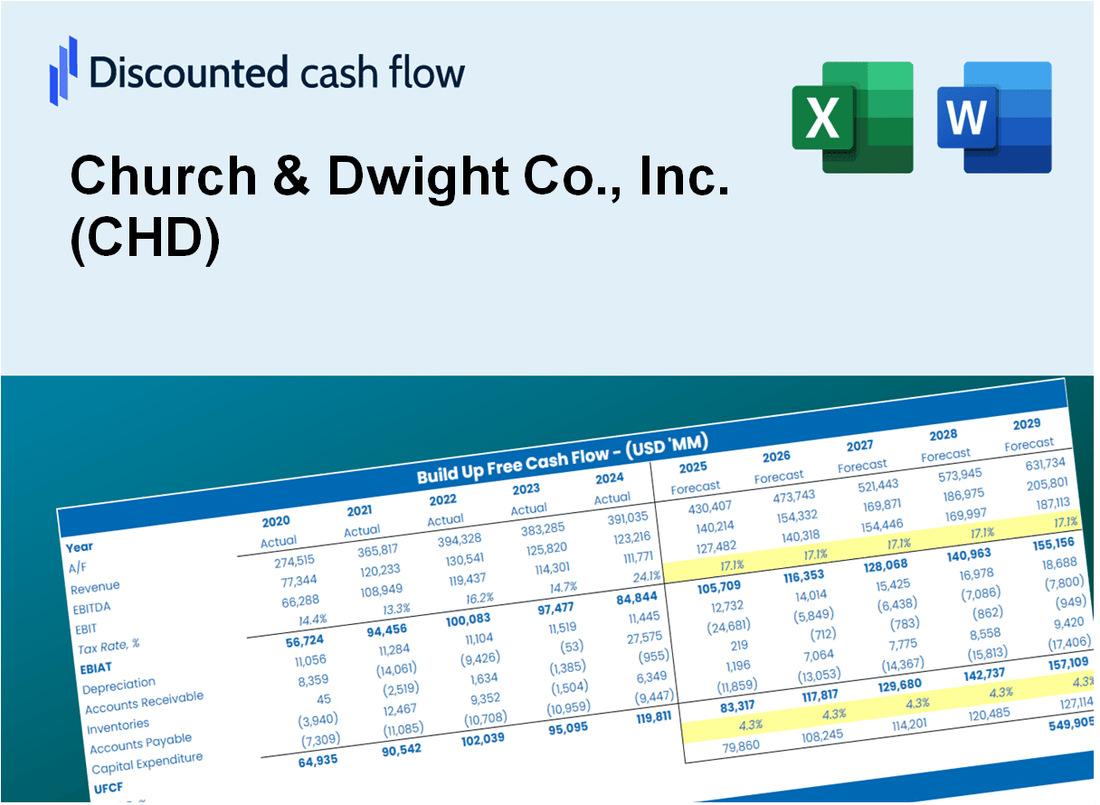
Church & Dwight Co., Inc. (CHD) Bundle
تبسيط الكنيسة & Dwight Co. ، Inc. (CHD) التقييم مع هذه الآلة الحاسبة DCF القابلة للتخصيص! مع الكنيسة الحقيقية & بيانات Dwight Co. ، Inc. (CHD) ومدخلات التنبؤ القابلة للتعديل ، يمكنك اختبار السيناريوهات وكشف الكنيسة & Dwight Co. ، Inc. (CHD) القيمة العادلة في دقائق.
Discounted Cash Flow (DCF) - (USD MM)
| Year | AY1 2020 |
AY2 2021 |
AY3 2022 |
AY4 2023 |
AY5 2024 |
FY1 2025 |
FY2 2026 |
FY3 2027 |
FY4 2028 |
FY5 2029 |
|---|---|---|---|---|---|---|---|---|---|---|
| Revenue | 4,895.8 | 5,190.1 | 5,375.6 | 5,867.9 | 6,107.1 | 6,455.5 | 6,823.8 | 7,213.1 | 7,624.6 | 8,059.6 |
| Revenue Growth, % | 0 | 6.01 | 3.57 | 9.16 | 4.08 | 5.7 | 5.7 | 5.7 | 5.7 | 5.7 |
| EBITDA | 1,224.5 | 1,305.3 | 831.9 | 1,303.5 | 1,090.4 | 1,364.8 | 1,442.6 | 1,524.9 | 1,611.9 | 1,703.9 |
| EBITDA, % | 25.01 | 25.15 | 15.48 | 22.21 | 17.85 | 21.14 | 21.14 | 21.14 | 21.14 | 21.14 |
| Depreciation | 189.7 | 219.1 | 219.0 | 225.2 | 239.1 | 257.2 | 271.9 | 287.4 | 303.8 | 321.1 |
| Depreciation, % | 3.87 | 4.22 | 4.07 | 3.84 | 3.92 | 3.98 | 3.98 | 3.98 | 3.98 | 3.98 |
| EBIT | 1,034.8 | 1,086.2 | 612.9 | 1,078.3 | 851.3 | 1,107.5 | 1,170.7 | 1,237.5 | 1,308.1 | 1,382.7 |
| EBIT, % | 21.14 | 20.93 | 11.4 | 18.38 | 13.94 | 17.16 | 17.16 | 17.16 | 17.16 | 17.16 |
| Total Cash | 183.1 | 240.6 | 270.3 | 344.5 | 964.1 | 452.7 | 478.5 | 505.8 | 534.7 | 565.2 |
| Total Cash, percent | .0 | .0 | .0 | .0 | .0 | .0 | .0 | .0 | .0 | .0 |
| Account Receivables | 398.8 | 405.5 | 422.0 | 526.9 | 600.8 | 550.3 | 581.7 | 614.9 | 650.0 | 687.1 |
| Account Receivables, % | 8.15 | 7.81 | 7.85 | 8.98 | 9.84 | 8.53 | 8.53 | 8.53 | 8.53 | 8.53 |
| Inventories | 495.4 | 535.4 | 646.6 | 613.3 | 613.3 | 683.7 | 722.7 | 764.0 | 807.6 | 853.6 |
| Inventories, % | 10.12 | 10.32 | 12.03 | 10.45 | 10.04 | 10.59 | 10.59 | 10.59 | 10.59 | 10.59 |
| Accounts Payable | 588.1 | 663.8 | 666.7 | 630.6 | 705.1 | 768.2 | 812.0 | 858.3 | 907.3 | 959.0 |
| Accounts Payable, % | 12.01 | 12.79 | 12.4 | 10.75 | 11.55 | 11.9 | 11.9 | 11.9 | 11.9 | 11.9 |
| Capital Expenditure | -98.9 | -118.8 | -178.8 | -223.5 | -179.8 | -185.8 | -196.4 | -207.6 | -219.4 | -231.9 |
| Capital Expenditure, % | -2.02 | -2.29 | -3.33 | -3.81 | -2.94 | -2.88 | -2.88 | -2.88 | -2.88 | -2.88 |
| Tax Rate, % | 22.61 | 22.61 | 22.61 | 22.61 | 22.61 | 22.61 | 22.61 | 22.61 | 22.61 | 22.61 |
| EBITAT | 835.1 | 871.2 | 484.8 | 842.2 | 658.8 | 876.1 | 926.0 | 978.9 | 1,034.7 | 1,093.7 |
| Depreciation | ||||||||||
| Changes in Account Receivables | ||||||||||
| Changes in Inventories | ||||||||||
| Changes in Accounts Payable | ||||||||||
| Capital Expenditure | ||||||||||
| UFCF | 619.8 | 1,000.5 | 400.2 | 736.2 | 718.7 | 990.6 | 975.0 | 1,030.6 | 1,089.4 | 1,151.6 |
| WACC, % | 5.46 | 5.46 | 5.46 | 5.45 | 5.45 | 5.46 | 5.46 | 5.46 | 5.46 | 5.46 |
| PV UFCF | ||||||||||
| SUM PV UFCF | 4,458.6 | |||||||||
| Long Term Growth Rate, % | 4.00 | |||||||||
| Free cash flow (T + 1) | 1,198 | |||||||||
| Terminal Value | 82,210 | |||||||||
| Present Terminal Value | 63,031 | |||||||||
| Enterprise Value | 67,489 | |||||||||
| Net Debt | 1,441 | |||||||||
| Equity Value | 66,048 | |||||||||
| Diluted Shares Outstanding, MM | 247 | |||||||||
| Equity Value Per Share | 267.51 |
What You Will Get
- Pre-Filled Financial Model: Church & Dwight’s actual data enables precise DCF valuation.
- Full Forecast Control: Adjust revenue growth, margins, WACC, and other key drivers.
- Instant Calculations: Automatic updates ensure you see results as you make changes.
- Investor-Ready Template: A refined Excel file designed for professional-grade valuation.
- Customizable and Reusable: Tailored for flexibility, allowing repeated use for detailed forecasts.
Key Features
- Accurate Financial Data for Church & Dwight Co., Inc.: Access reliable pre-loaded historical data and future forecasts.
- Customizable Assumptions: Modify highlighted inputs such as WACC, growth rates, and profit margins.
- Real-Time Calculations: Automatic adjustments to DCF, Net Present Value (NPV), and cash flow projections.
- User-Friendly Dashboard: Intuitive charts and summaries to help visualize your valuation insights.
- Suitable for All Levels: A straightforward design tailored for investors, CFOs, and consultants alike.
How It Works
- Step 1: Download the Excel file.
- Step 2: Review pre-entered Church & Dwight data (historical and projected).
- Step 3: Adjust key assumptions (yellow cells) based on your analysis.
- Step 4: View automatic recalculations for Church & Dwight’s intrinsic value.
- Step 5: Use the outputs for investment decisions or reporting.
Why Choose This Calculator for Church & Dwight Co., Inc. (CHD)?
- Designed for Industry Experts: A sophisticated tool utilized by financial analysts, CFOs, and industry consultants.
- Comprehensive Data: Church & Dwight’s historical and projected financials preloaded for enhanced accuracy.
- Flexible Scenario Analysis: Easily simulate various forecasts and assumptions for better decision-making.
- Insightful Outputs: Automatically computes intrinsic value, NPV, and essential financial metrics.
- User-Friendly Interface: Clear, step-by-step instructions help you navigate the calculator effortlessly.
Who Should Use This Product?
- Investors: Accurately estimate Church & Dwight Co., Inc.'s (CHD) fair value before making investment decisions.
- CFOs: Leverage a professional-grade DCF model for financial reporting and analysis specific to Church & Dwight Co., Inc. (CHD).
- Consultants: Quickly adapt the template for valuation reports tailored to Church & Dwight Co., Inc. (CHD) clients.
- Entrepreneurs: Gain insights into financial modeling practices used by leading companies like Church & Dwight Co., Inc. (CHD).
- Educators: Use it as a teaching tool to demonstrate valuation methodologies relevant to Church & Dwight Co., Inc. (CHD).
What the Template Contains
- Preloaded CHD Data: Historical and projected financial data, including revenue, EBIT, and capital expenditures.
- DCF and WACC Models: Professional-grade sheets for calculating intrinsic value and Weighted Average Cost of Capital.
- Editable Inputs: Yellow-highlighted cells for adjusting revenue growth, tax rates, and discount rates.
- Financial Statements: Comprehensive annual and quarterly financials for deeper analysis.
- Key Ratios: Profitability, leverage, and efficiency ratios to evaluate performance.
- Dashboard and Charts: Visual summaries of valuation outcomes and assumptions.
Disclaimer
All information, articles, and product details provided on this website are for general informational and educational purposes only. We do not claim any ownership over, nor do we intend to infringe upon, any trademarks, copyrights, logos, brand names, or other intellectual property mentioned or depicted on this site. Such intellectual property remains the property of its respective owners, and any references here are made solely for identification or informational purposes, without implying any affiliation, endorsement, or partnership.
We make no representations or warranties, express or implied, regarding the accuracy, completeness, or suitability of any content or products presented. Nothing on this website should be construed as legal, tax, investment, financial, medical, or other professional advice. In addition, no part of this site—including articles or product references—constitutes a solicitation, recommendation, endorsement, advertisement, or offer to buy or sell any securities, franchises, or other financial instruments, particularly in jurisdictions where such activity would be unlawful.
All content is of a general nature and may not address the specific circumstances of any individual or entity. It is not a substitute for professional advice or services. Any actions you take based on the information provided here are strictly at your own risk. You accept full responsibility for any decisions or outcomes arising from your use of this website and agree to release us from any liability in connection with your use of, or reliance upon, the content or products found herein.