
|
Cholamandalam Financial Holdings Limited (cholahldng.ns) تقييم DCF |
Fully Editable: Tailor To Your Needs In Excel Or Sheets
Professional Design: Trusted, Industry-Standard Templates
Investor-Approved Valuation Models
MAC/PC Compatible, Fully Unlocked
No Expertise Is Needed; Easy To Follow
Cholamandalam Financial Holdings Limited (CHOLAHLDNG.NS) Bundle
تبسيط تقييم Cholamandalam Financial Holdings Limited مع هذه الآلة الحاسبة DCF القابلة للتخصيص! يتميز Cholamandalam Financial Holdings المحدودة والمدخلات المتوقعة القابلة للتعديل ، يمكنك اختبار السيناريوهات والكشف عن Cholamandalam Financial Holdings Limited في دقائق.
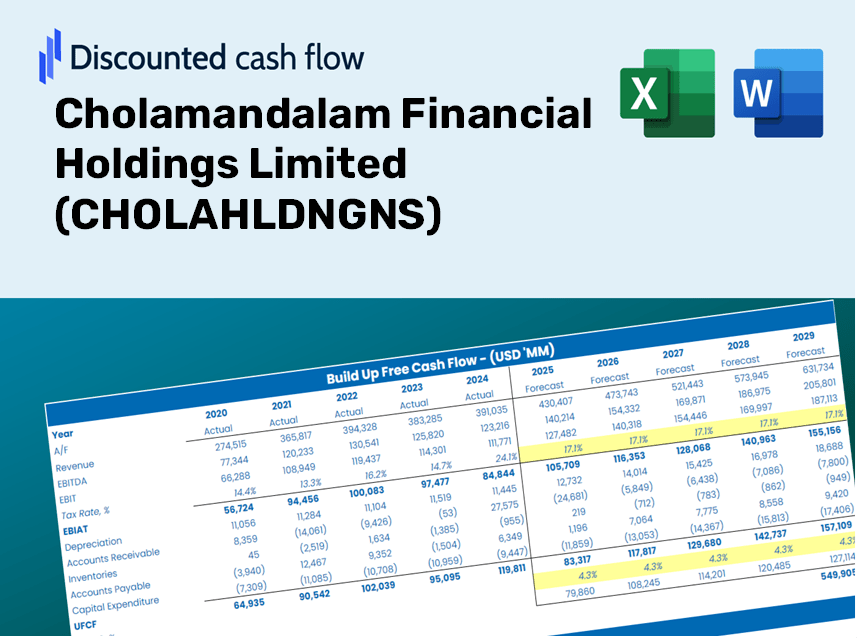
Discounted Cash Flow (DCF) - (USD MM)
| Year | AY1 2021 |
AY2 2022 |
AY3 2023 |
AY4 2024 |
AY5 2025 |
FY1 2026 |
FY2 2027 |
FY3 2028 |
FY4 2029 |
FY5 2030 |
|---|---|---|---|---|---|---|---|---|---|---|
| Revenue | 144,539.9 | 156,335.7 | 193,743.2 | 153,205.9 | 331,272.0 | 423,337.0 | 540,988.0 | 691,335.9 | 883,467.4 | 1,128,994.9 |
| Revenue Growth, % | 0 | 8.16 | 23.93 | -20.92 | 116.23 | 27.79 | 27.79 | 27.79 | 27.79 | 27.79 |
| EBITDA | 37,264.6 | 44,157.3 | 56,540.9 | 77,766.0 | 192,113.4 | 162,529.2 | 207,698.2 | 265,420.3 | 339,184.2 | 433,448.1 |
| EBITDA, % | 25.78 | 28.25 | 29.18 | 50.76 | 57.99 | 38.39 | 38.39 | 38.39 | 38.39 | 38.39 |
| Depreciation | 1,454.7 | 1,541.6 | 1,760.6 | 2,475.4 | 2,957.3 | 4,580.2 | 5,853.2 | 7,479.8 | 9,558.6 | 12,215.0 |
| Depreciation, % | 1.01 | 0.98608 | 0.90873 | 1.62 | 0.89271 | 1.08 | 1.08 | 1.08 | 1.08 | 1.08 |
| EBIT | 35,809.9 | 42,615.7 | 54,780.3 | 75,290.6 | 189,156.1 | 157,948.9 | 201,845.0 | 257,940.5 | 329,625.6 | 421,233.1 |
| EBIT, % | 24.78 | 27.26 | 28.27 | 49.14 | 57.1 | 37.31 | 37.31 | 37.31 | 37.31 | 37.31 |
| Total Cash | 84,872.7 | 48,573.9 | 46,871.7 | 49,988.2 | 127,732.3 | 156,777.3 | 200,347.8 | 256,027.1 | 327,180.5 | 418,108.4 |
| Total Cash, percent | .0 | .0 | .0 | .0 | .0 | .0 | .0 | .0 | .0 | .0 |
| Account Receivables | 6,058.5 | 6,195.9 | 6,731.3 | 7,879.9 | 9,749.4 | 16,692.6 | 21,331.7 | 27,260.0 | 34,836.0 | 44,517.4 |
| Account Receivables, % | 4.19 | 3.96 | 3.47 | 5.14 | 2.94 | 3.94 | 3.94 | 3.94 | 3.94 | 3.94 |
| Inventories | .0 | .0 | .0 | .0 | .0 | .0 | .0 | .0 | .0 | .0 |
| Inventories, % | 0 | 0 | 0 | 0 | 0 | 0 | 0 | 0 | 0 | 0 |
| Accounts Payable | 6,906.3 | 7,512.6 | 9,577.4 | 12,118.8 | 14,124.0 | 22,606.7 | 28,889.4 | 36,918.2 | 47,178.2 | 60,289.7 |
| Accounts Payable, % | 4.78 | 4.81 | 4.94 | 7.91 | 4.26 | 5.34 | 5.34 | 5.34 | 5.34 | 5.34 |
| Capital Expenditure | -641.4 | -1,380.2 | -2,607.6 | -11,687.1 | -3,414.8 | -9,594.2 | -12,260.6 | -15,668.0 | -20,022.3 | -25,586.8 |
| Capital Expenditure, % | -0.44375 | -0.88284 | -1.35 | -7.63 | -1.03 | -2.27 | -2.27 | -2.27 | -2.27 | -2.27 |
| Tax Rate, % | 66.07 | 66.07 | 66.07 | 66.07 | 66.07 | 66.07 | 66.07 | 66.07 | 66.07 | 66.07 |
| EBITAT | 12,302.8 | 14,324.9 | 18,523.2 | 25,665.1 | 64,189.2 | 53,641.5 | 68,549.2 | 87,599.9 | 111,945.1 | 143,056.1 |
| Depreciation | ||||||||||
| Changes in Account Receivables | ||||||||||
| Changes in Inventories | ||||||||||
| Changes in Accounts Payable | ||||||||||
| Capital Expenditure | ||||||||||
| UFCF | 13,963.9 | 14,955.2 | 19,205.6 | 17,846.2 | 63,867.4 | 50,167.0 | 63,785.3 | 81,512.1 | 104,165.4 | 133,114.4 |
| WACC, % | 2.1 | 2.08 | 2.09 | 2.1 | 2.09 | 2.09 | 2.09 | 2.09 | 2.09 | 2.09 |
| PV UFCF | ||||||||||
| SUM PV UFCF | 402,861.4 | |||||||||
| Long Term Growth Rate, % | 2.00 | |||||||||
| Free cash flow (T + 1) | 135,777 | |||||||||
| Terminal Value | 148,916,949 | |||||||||
| Present Terminal Value | 134,277,453 | |||||||||
| Enterprise Value | 134,680,314 | |||||||||
| Net Debt | 1,646,866 | |||||||||
| Equity Value | 133,033,449 | |||||||||
| Diluted Shares Outstanding, MM | 188 | |||||||||
| Equity Value Per Share | 708,480.18 |
ما ستناله
- مدخلات التوقعات القابلة للتعديل: قم بتعديل الافتراضات (النمو٪، الهوامش، WACC) دون عناء لاستكشاف سيناريوهات مختلفة.
- البيانات المالية الحالية: تم توفير البيانات المالية لشركة Cholamandalam Financial Holdings Limited لتبسيط تحليلك.
- حسابات DCF التلقائية: يحسب النموذج صافي القيمة الحالية (NPV) والقيمة الجوهرية تلقائيًا.
- مصممة وفنية: نموذج Excel منقح يمكن تخصيصه لتلبية متطلبات التقييم الخاصة بك.
- مصمم للمحللين والمستثمرين: مثالي لاختبار التوقعات والتحقق من صحة الاستراتيجيات وتعزيز الكفاءة.
الميزات الرئيسية
- البيانات التي تم تحميلها مسبقًا: البيانات المالية التاريخية لشركة Cholamandalam Financial Limited والتوقعات المليئة مسبقًا.
- مدخلات قابلة للتعديل بالكامل: تخصيص WACC ، ومعدلات الضرائب ، ونمو الإيرادات ، وهامش الأرباح قبل الفوائد والضرائب والإهلاك والاستهلاك.
- النتائج الفورية: عرض القيمة الجوهرية لـ Cholamandalam Financial Holdings Limited في الوقت الفعلي.
- واضحة المخرجات المرئية: تقدم مخططات لوحة القيادة نتائج التقييم والمقاييس الرئيسية.
- بنيت للدقة: أداة مهنية مصممة للمحللين والمستثمرين وخبراء التمويل.
كيف تعمل
- قم بتنزيل القالب: الحصول على وصول فوري إلى حاسبة Cholahldngns المستندة إلى Excel.
- أدخل افتراضاتك: تعديل الخلايا ذات الضوء الصفراء لمعدلات النمو ، و WACC ، هوامش الربح ، والمتغيرات الأخرى.
- الحسابات الفورية: يتم تحديث النموذج تلقائيًا لعرض القيمة الجوهرية لـ Cholamandalam Financial Holdings Limited.
- سيناريوهات الاختبار: تجربة الافتراضات المختلفة لتقييم التغييرات المحتملة في التقييم.
- تحليل وتحديد: الاستفادة من النتائج لإبلاغ استراتيجيات الاستثمار أو التقييمات المالية.
لماذا تختار هذه الآلة الحاسبة؟
- مصمم للمهنيين: أداة متقدمة تستخدمها المحللين والمديرين الماليين والمستشارين الماليين.
- بيانات الوقت الحقيقي: يتم تحميل البيانات المالية التاريخية والمتوقعة في Cholamandalam Financial Holdings Limited (Cholahldngns) للدقة.
- محاكاة السيناريو: اختبار دون عناء التنبؤات والافتراضات.
- نتائج شفافة: يحسب على الفور القيمة الجوهرية ، NPV ، والمقاييس الأساسية.
- سهل الاستخدام: تعليمات بديهية خطوة بخطوة لمساعدتك خلال العملية.
من يمكنه الاستفادة من هذا المنتج؟
- المستثمرون المؤسسيون: قم بإنشاء نماذج تقييم شاملة ودقيقة لتقييم المحافظ التي تشمل Cholamandalam Financial Holdings Limited (Cholahldngns).
- إدارات تمويل الشركات: تقييم سيناريوهات التقييم المختلفة لإبلاغ القرارات الاستراتيجية داخل المنظمة.
- المستشارون والمستشارون الماليون: تقديم رؤى تقييم دقيقة تتعلق بـ Cholamandalam Financial Holdings Limited (Cholahldngns) لإشارات العميل.
- الطلاب والمعلمين: الاستفادة من بيانات السوق الحقيقية لممارسة تقنيات النمذجة المالية والتوجيه.
- عشاق المالية: اكتساب نظرة ثاقبة على كيفية تقييم الشركات المالية مثل Cholamandalam Financial Holdings Limited (Cholahldngns) في السوق.
محتويات القالب
- نموذج DCF المليء مسبقًا: Cholamandalam Financial Holdings Limited (Cholahldngns) البيانات المالية جاهزة للتطبيق الفوري.
- حاسبة WACC: حسابات شاملة لمتوسط تكلفة رأس المال المرجح.
- النسب المالية: تقييم الربحية والرافعة المالية والرافعة المالية في Cholamandalam.
- مدخلات قابلة للتحرير: تعديل الافتراضات مثل معدلات النمو والهوامش والنفقات الرأسمالية لتناسب سيناريوهاتك.
- البيانات المالية: التقارير السنوية والفصلية المقدمة للتحليل المتعمق.
- لوحة القيادة التفاعلية: تصور دون عناء مقاييس التقييم الرئيسية والنتائج.
Disclaimer
All information, articles, and product details provided on this website are for general informational and educational purposes only. We do not claim any ownership over, nor do we intend to infringe upon, any trademarks, copyrights, logos, brand names, or other intellectual property mentioned or depicted on this site. Such intellectual property remains the property of its respective owners, and any references here are made solely for identification or informational purposes, without implying any affiliation, endorsement, or partnership.
We make no representations or warranties, express or implied, regarding the accuracy, completeness, or suitability of any content or products presented. Nothing on this website should be construed as legal, tax, investment, financial, medical, or other professional advice. In addition, no part of this site—including articles or product references—constitutes a solicitation, recommendation, endorsement, advertisement, or offer to buy or sell any securities, franchises, or other financial instruments, particularly in jurisdictions where such activity would be unlawful.
All content is of a general nature and may not address the specific circumstances of any individual or entity. It is not a substitute for professional advice or services. Any actions you take based on the information provided here are strictly at your own risk. You accept full responsibility for any decisions or outcomes arising from your use of this website and agree to release us from any liability in connection with your use of, or reliance upon, the content or products found herein.