
|
تقييم ChampionX Corporation (CHX) DCF |
Fully Editable: Tailor To Your Needs In Excel Or Sheets
Professional Design: Trusted, Industry-Standard Templates
Investor-Approved Valuation Models
MAC/PC Compatible, Fully Unlocked
No Expertise Is Needed; Easy To Follow
ChampionX Corporation (CHX) Bundle
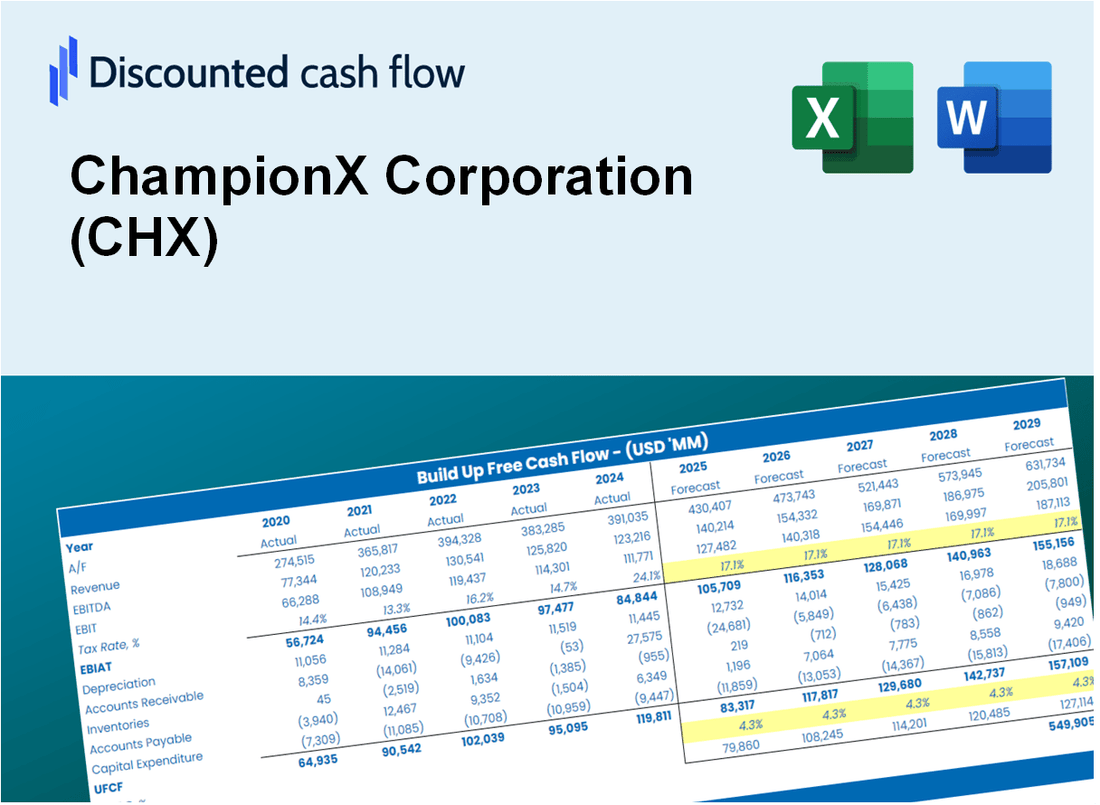
تم تصميم حاسبة DCF (CHX) للدقة، وهي تمكنك من تقييم تقييم ChampionX Corporation باستخدام البيانات المالية في العالم الحقيقي، مما يوفر مرونة كاملة لتعديل جميع المعلمات الرئيسية للتوقعات المحسنة.
What You Will Receive
- Authentic ChampionX Data: Preloaded financial metrics – from revenue to EBIT – utilizing both actual and projected figures.
- Comprehensive Customization: Modify all essential parameters (yellow cells) such as WACC, growth %, and tax rates.
- Immediate Valuation Adjustments: Automatic recalculations to assess the effects of changes on ChampionX's fair value.
- Flexible Excel Template: Designed for quick modifications, scenario analysis, and extensive projections.
- Efficient and Precise: Avoid constructing models from the ground up while ensuring accuracy and adaptability.
Key Features
- Comprehensive ChampionX Financials: Gain access to reliable pre-loaded historical data and future forecasts.
- Tailored Forecast Assumptions: Modify highlighted cells for variables such as WACC, growth rates, and profit margins.
- Real-Time Calculations: Enjoy automatic updates for DCF, Net Present Value (NPV), and cash flow evaluations.
- Interactive Dashboard: Clear and concise charts and summaries to help visualize your valuation outcomes.
- Designed for All Users: A user-friendly layout suitable for investors, CFOs, and consultants alike.
How It Works
- Step 1: Download the prebuilt Excel template containing ChampionX Corporation’s (CHX) data.
- Step 2: Review the pre-filled sheets to familiarize yourself with the essential metrics.
- Step 3: Modify forecasts and assumptions in the editable yellow cells (WACC, growth, margins).
- Step 4: Instantly see the recalculated results, including ChampionX Corporation’s (CHX) intrinsic value.
- Step 5: Make well-informed investment decisions or create reports based on the outputs.
Why Choose This Calculator for ChampionX Corporation (CHX)?
- All-in-One Solution: Features DCF, WACC, and financial ratio analyses tailored for ChampionX Corporation (CHX).
- Flexible Inputs: Modify the yellow-highlighted cells to explore different financial scenarios.
- In-Depth Analysis: Automatically computes ChampionX Corporation’s (CHX) intrinsic value and Net Present Value.
- Preloaded Information: Access to historical and projected data for reliable analysis.
- High-Quality Standards: Perfect for financial analysts, investors, and business advisors focusing on ChampionX Corporation (CHX).
Who Should Use ChampionX Corporation (CHX) Products?
- Investors: Accurately assess ChampionX's fair value before making investment choices.
- CFOs: Utilize a high-quality DCF model for financial reporting and analysis related to ChampionX.
- Consultants: Efficiently customize the template for valuation reports tailored to ChampionX clients.
- Entrepreneurs: Acquire knowledge of financial modeling practices employed by industry leaders like ChampionX.
- Educators: Employ it as a teaching resource to illustrate valuation techniques relevant to ChampionX.
What the Template Contains
- Pre-Filled DCF Model: ChampionX Corporation’s (CHX) financial data preloaded for immediate use.
- WACC Calculator: Detailed calculations for Weighted Average Cost of Capital.
- Financial Ratios: Evaluate ChampionX Corporation’s profitability, leverage, and efficiency.
- Editable Inputs: Change assumptions such as growth, margins, and CAPEX to fit your scenarios.
- Financial Statements: Annual and quarterly reports to support detailed analysis.
- Interactive Dashboard: Easily visualize key valuation metrics and results.
Disclaimer
All information, articles, and product details provided on this website are for general informational and educational purposes only. We do not claim any ownership over, nor do we intend to infringe upon, any trademarks, copyrights, logos, brand names, or other intellectual property mentioned or depicted on this site. Such intellectual property remains the property of its respective owners, and any references here are made solely for identification or informational purposes, without implying any affiliation, endorsement, or partnership.
We make no representations or warranties, express or implied, regarding the accuracy, completeness, or suitability of any content or products presented. Nothing on this website should be construed as legal, tax, investment, financial, medical, or other professional advice. In addition, no part of this site—including articles or product references—constitutes a solicitation, recommendation, endorsement, advertisement, or offer to buy or sell any securities, franchises, or other financial instruments, particularly in jurisdictions where such activity would be unlawful.
All content is of a general nature and may not address the specific circumstances of any individual or entity. It is not a substitute for professional advice or services. Any actions you take based on the information provided here are strictly at your own risk. You accept full responsibility for any decisions or outcomes arising from your use of this website and agree to release us from any liability in connection with your use of, or reliance upon, the content or products found herein.