
|
City Office REIT ، Inc. (CIO) تقييم DCF |
Fully Editable: Tailor To Your Needs In Excel Or Sheets
Professional Design: Trusted, Industry-Standard Templates
Investor-Approved Valuation Models
MAC/PC Compatible, Fully Unlocked
No Expertise Is Needed; Easy To Follow
City Office REIT, Inc. (CIO) Bundle
قم بتحسين وقتك وتحسين الدقة مع مكتب المدينة REIT، Inc. (CIO) حاسبة DCF! باستخدام البيانات الحقيقية من City Office REIT والافتراضات القابلة للتخصيص، تمكنك هذه الأداة من التنبؤ بـ City Office REIT وتحليله وتقييمه مثل المستثمر المخضرم.
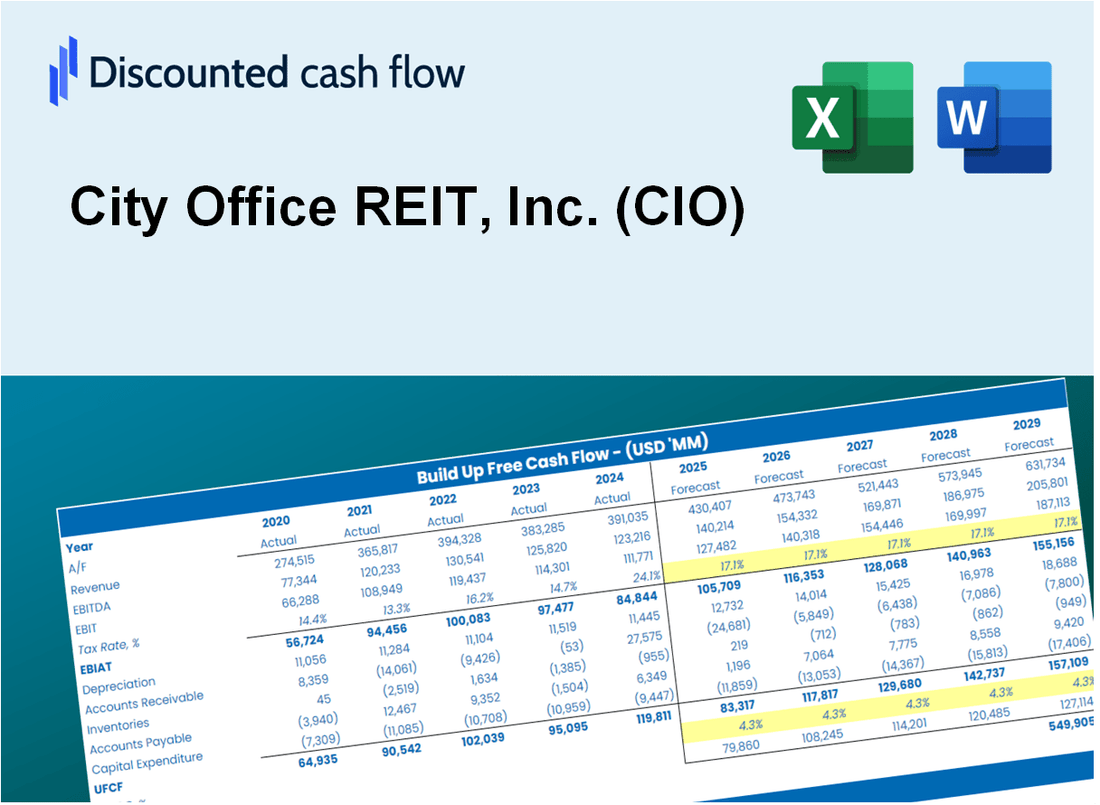
Discounted Cash Flow (DCF) - (USD MM)
| Year | AY1 2020 |
AY2 2021 |
AY3 2022 |
AY4 2023 |
AY5 2024 |
FY1 2025 |
FY2 2026 |
FY3 2027 |
FY4 2028 |
FY5 2029 |
|---|---|---|---|---|---|---|---|---|---|---|
| Revenue | 160.8 | 164.0 | 180.5 | 179.1 | 171.1 | 174.0 | 177.0 | 180.0 | 183.1 | 186.2 |
| Revenue Growth, % | 0 | 1.99 | 10.02 | -0.76959 | -4.45 | 1.7 | 1.7 | 1.7 | 1.7 | 1.7 |
| EBITDA | 91.8 | 90.5 | 97.7 | 92.8 | 75.2 | 91.3 | 92.8 | 94.4 | 96.0 | 97.6 |
| EBITDA, % | 57.1 | 55.2 | 54.16 | 51.83 | 43.92 | 52.44 | 52.44 | 52.44 | 52.44 | 52.44 |
| Depreciation | 129.4 | 130.8 | 144.0 | 63.0 | 59.3 | 107.8 | 109.7 | 111.5 | 113.4 | 115.3 |
| Depreciation, % | 80.43 | 79.74 | 79.79 | 35.17 | 34.67 | 61.96 | 61.96 | 61.96 | 61.96 | 61.96 |
| EBIT | -37.5 | -40.3 | -46.3 | 29.8 | 15.8 | -16.6 | -16.8 | -17.1 | -17.4 | -17.7 |
| EBIT, % | -23.33 | -24.55 | -25.64 | 16.66 | 9.25 | -9.52 | -9.52 | -9.52 | -9.52 | -9.52 |
| Total Cash | 25.3 | 21.3 | 28.2 | 30.1 | 18.9 | 25.1 | 25.6 | 26.0 | 26.4 | 26.9 |
| Total Cash, percent | .0 | .0 | .0 | .0 | .0 | .0 | .0 | .0 | .0 | .0 |
| Account Receivables | 33.0 | 30.4 | 44.4 | 53.5 | 52.3 | 43.2 | 43.9 | 44.7 | 45.4 | 46.2 |
| Account Receivables, % | 20.5 | 18.54 | 24.62 | 29.85 | 30.57 | 24.81 | 24.81 | 24.81 | 24.81 | 24.81 |
| Inventories | .0 | .0 | .0 | .0 | .0 | .0 | .0 | .0 | .0 | .0 |
| Inventories, % | 0 | 0 | 0 | 0 | 0 | 0 | 0 | 0 | 0 | 0 |
| Accounts Payable | 25.4 | 27.1 | .0 | .0 | .0 | 11.3 | 11.4 | 11.6 | 11.8 | 12.0 |
| Accounts Payable, % | 15.8 | 16.52 | 0 | 0 | 0 | 6.46 | 6.46 | 6.46 | 6.46 | 6.46 |
| Capital Expenditure | -7.8 | -8.2 | -9.6 | .0 | .0 | -5.3 | -5.4 | -5.4 | -5.5 | -5.6 |
| Capital Expenditure, % | -4.84 | -4.99 | -5.3 | 0 | 0 | -3.03 | -3.03 | -3.03 | -3.03 | -3.03 |
| Tax Rate, % | -3.24 | -3.24 | -3.24 | -3.24 | -3.24 | -3.24 | -3.24 | -3.24 | -3.24 | -3.24 |
| EBITAT | 159.8 | -40.2 | -66.0 | 39.3 | 16.3 | -13.2 | -13.5 | -13.7 | -13.9 | -14.2 |
| Depreciation | ||||||||||
| Changes in Account Receivables | ||||||||||
| Changes in Inventories | ||||||||||
| Changes in Accounts Payable | ||||||||||
| Capital Expenditure | ||||||||||
| UFCF | 273.8 | 86.7 | 27.4 | 93.3 | 76.8 | 109.7 | 90.3 | 91.8 | 93.4 | 95.0 |
| WACC, % | 3.4 | 6.96 | 6.97 | 6.97 | 6.97 | 6.25 | 6.25 | 6.25 | 6.25 | 6.25 |
| PV UFCF | ||||||||||
| SUM PV UFCF | 403.2 | |||||||||
| Long Term Growth Rate, % | 3.50 | |||||||||
| Free cash flow (T + 1) | 98 | |||||||||
| Terminal Value | 3,574 | |||||||||
| Present Terminal Value | 2,639 | |||||||||
| Enterprise Value | 3,043 | |||||||||
| Net Debt | 628 | |||||||||
| Equity Value | 2,414 | |||||||||
| Diluted Shares Outstanding, MM | 40 | |||||||||
| Equity Value Per Share | 60.15 |
What You Will Get
- Real CIO Financial Data: Pre-filled with City Office REIT’s historical and projected data for precise analysis.
- Fully Editable Template: Modify key inputs like revenue growth, WACC, and EBITDA % with ease.
- Automatic Calculations: See City Office REIT’s intrinsic value update instantly based on your changes.
- Professional Valuation Tool: Designed for investors, analysts, and consultants seeking accurate DCF results.
- User-Friendly Design: Simple structure and clear instructions for all experience levels.
Key Features
- Customizable Investment Metrics: Adjust essential factors such as rental income growth, occupancy rates, and operating expenses.
- Instant DCF Analysis: Automatically computes intrinsic value, NPV, and other financial metrics in real-time.
- High-Precision Valuations: Leverages City Office REIT's (CIO) actual financial data for accurate investment assessments.
- Streamlined Scenario Testing: Easily evaluate varying assumptions and analyze different financial outcomes.
- Efficiency Booster: Remove the hassle of constructing complex valuation frameworks from the ground up.
How It Works
- Download the Template: Gain immediate access to the Excel-based CIO DCF Calculator.
- Input Your Assumptions: Modify the yellow-highlighted cells for growth rates, WACC, margins, and other parameters.
- Instant Calculations: The model automatically recalculates City Office REIT’s intrinsic value.
- Test Scenarios: Experiment with various assumptions to assess potential changes in valuation.
- Analyze and Decide: Utilize the outcomes to inform your investment or financial analysis.
Why Choose This Calculator for City Office REIT, Inc. (CIO)?
- All-in-One Solution: Combines DCF, WACC, and financial ratio assessments tailored for real estate investment.
- Flexible Inputs: Modify the highlighted cells to explore different investment scenarios.
- In-Depth Analysis: Automatically computes City Office REIT’s intrinsic value and Net Present Value.
- Preloaded Information: Access to both historical and projected data for reliable analysis.
- Expert-Level Tool: Perfect for real estate analysts, investors, and financial advisors.
Who Should Use This Product?
- Investors: Evaluate City Office REIT, Inc. (CIO)'s performance before making investment decisions.
- CFOs and Financial Analysts: Enhance valuation methodologies and assess financial forecasts.
- Real Estate Professionals: Understand how publicly traded REITs like City Office REIT, Inc. (CIO) are valued.
- Consultants: Create detailed valuation reports for real estate clients.
- Students and Educators: Utilize current market data to learn and teach valuation strategies in real estate.
What the Template Contains
- Pre-Filled DCF Model: City Office REIT, Inc.’s (CIO) financial data preloaded for immediate use.
- WACC Calculator: Detailed calculations for Weighted Average Cost of Capital specific to City Office REIT, Inc. (CIO).
- Financial Ratios: Assess City Office REIT, Inc.’s (CIO) profitability, leverage, and efficiency metrics.
- Editable Inputs: Modify assumptions such as growth rates, margins, and CAPEX to suit your analysis of City Office REIT, Inc. (CIO).
- Financial Statements: Access annual and quarterly reports for in-depth evaluation of City Office REIT, Inc. (CIO).
- Interactive Dashboard: Visualize key valuation metrics and results for City Office REIT, Inc. (CIO) with ease.
Disclaimer
All information, articles, and product details provided on this website are for general informational and educational purposes only. We do not claim any ownership over, nor do we intend to infringe upon, any trademarks, copyrights, logos, brand names, or other intellectual property mentioned or depicted on this site. Such intellectual property remains the property of its respective owners, and any references here are made solely for identification or informational purposes, without implying any affiliation, endorsement, or partnership.
We make no representations or warranties, express or implied, regarding the accuracy, completeness, or suitability of any content or products presented. Nothing on this website should be construed as legal, tax, investment, financial, medical, or other professional advice. In addition, no part of this site—including articles or product references—constitutes a solicitation, recommendation, endorsement, advertisement, or offer to buy or sell any securities, franchises, or other financial instruments, particularly in jurisdictions where such activity would be unlawful.
All content is of a general nature and may not address the specific circumstances of any individual or entity. It is not a substitute for professional advice or services. Any actions you take based on the information provided here are strictly at your own risk. You accept full responsibility for any decisions or outcomes arising from your use of this website and agree to release us from any liability in connection with your use of, or reliance upon, the content or products found herein.