
|
Caledonia Mining Corporation PLC (CMCL) DCF تقييم |
Fully Editable: Tailor To Your Needs In Excel Or Sheets
Professional Design: Trusted, Industry-Standard Templates
Investor-Approved Valuation Models
MAC/PC Compatible, Fully Unlocked
No Expertise Is Needed; Easy To Follow
Caledonia Mining Corporation Plc (CMCL) Bundle
تبسيط تحليلك وتحسين الدقة مع حاسبة (CMCL) DCF! باستخدام بيانات حقيقية من Caledonia Mining Corporation PLC والافتراضات القابلة للتخصيص ، تمكنك هذه الأداة من التنبؤ وتقييم وتقييم (CMCL) مثل مستثمر خبير.
What You Will Receive
- Customizable Excel Template: A fully adaptable Excel-based DCF Calculator featuring pre-filled financial data for Caledonia Mining Corporation Plc (CMCL).
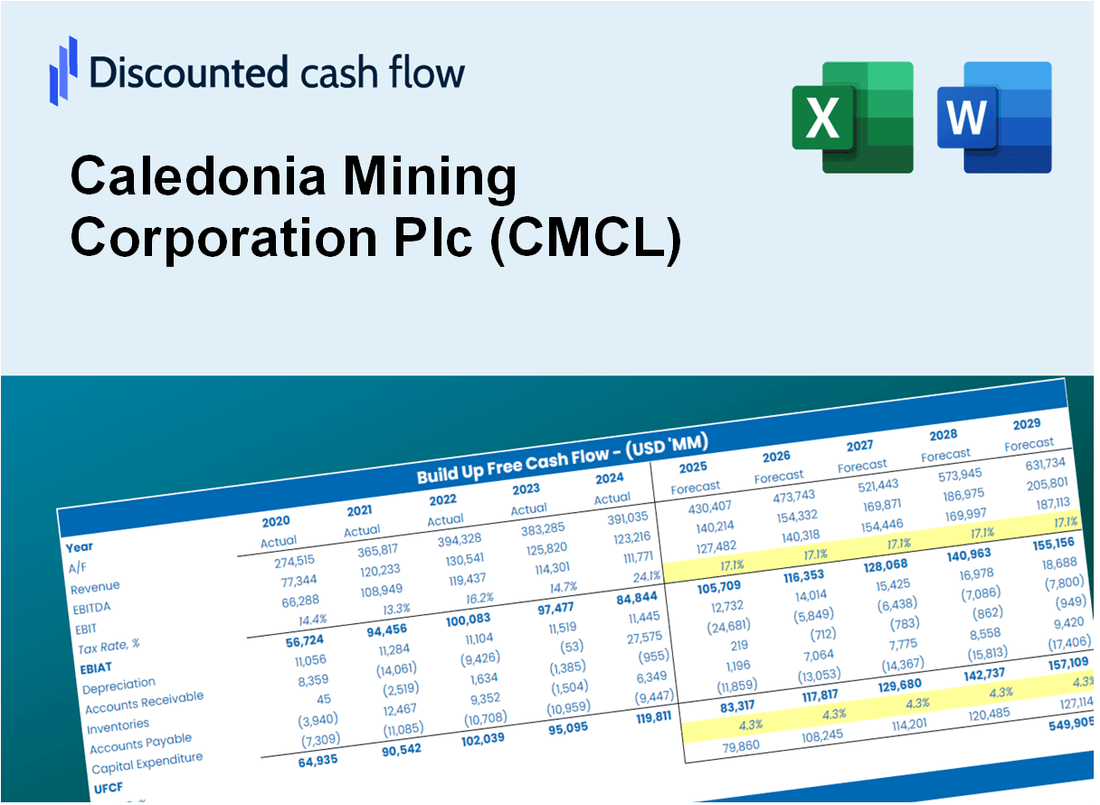
- Accurate Data: Historical performance metrics and projected estimates (highlighted in the yellow cells).
- Flexible Forecasting: Adjust forecast parameters such as revenue growth, EBITDA %, and WACC.
- Real-Time Calculations: Instantly observe how your inputs affect Caledonia Mining's valuation.
- Professional Resource: Designed for investors, CFOs, consultants, and financial analysts.
- Intuitive Layout: Organized for clarity and ease of navigation, complete with step-by-step guidance.
Key Features
- 🔍 Real-Life CMCL Financials: Pre-filled historical and projected data for Caledonia Mining Corporation Plc.
- ✏️ Fully Customizable Inputs: Adjust all critical parameters (yellow cells) like WACC, growth %, and tax rates.
- 📊 Professional DCF Valuation: Built-in formulas calculate Caledonia’s intrinsic value using the Discounted Cash Flow method.
- ⚡ Instant Results: Visualize Caledonia’s valuation instantly after making changes.
- Scenario Analysis: Test and compare outcomes for various financial assumptions side-by-side.
How It Functions
- Download: Obtain the pre-prepared Excel file featuring Caledonia Mining Corporation Plc's (CMCL) financial data.
- Customize: Modify projections, including revenue growth, EBITDA %, and WACC.
- Update Automatically: The intrinsic value and NPV calculations refresh in real-time.
- Test Scenarios: Develop various projections and instantly compare results.
- Make Decisions: Leverage the valuation outcomes to inform your investment strategy.
Why Choose This Calculator?
- Accuracy: Utilizes real Caledonia Mining Corporation Plc (CMCL) financial data for precise calculations.
- Flexibility: Allows users to easily test and adjust inputs as needed.
- Time-Saving: Avoid the complexities of creating a DCF model from the ground up.
- Professional-Grade: Crafted with the expertise and usability expected at the CFO level.
- User-Friendly: Intuitive design ensures accessibility for users of all financial backgrounds.
Who Should Use This Product?
- Mining Students: Understand mining valuation methods and apply them using real-world data.
- Researchers: Utilize industry models in academic studies or publications.
- Investors: Evaluate your investment strategies and assess valuation metrics for Caledonia Mining Corporation Plc (CMCL).
- Market Analysts: Enhance your analysis with a ready-made, adaptable DCF model tailored for mining companies.
- Entrepreneurs: Discover how large mining firms like Caledonia are evaluated in the market.
What the Template Contains
- Pre-Filled Data: Includes Caledonia Mining Corporation Plc’s historical financials and forecasts.
- Discounted Cash Flow Model: Editable DCF valuation model with automatic calculations.
- Weighted Average Cost of Capital (WACC): A dedicated sheet for calculating WACC based on custom inputs.
- Key Financial Ratios: Analyze Caledonia Mining Corporation Plc’s profitability, efficiency, and leverage.
- Customizable Inputs: Edit revenue growth, margins, and tax rates with ease.
- Clear Dashboard: Charts and tables summarizing key valuation results.
Disclaimer
All information, articles, and product details provided on this website are for general informational and educational purposes only. We do not claim any ownership over, nor do we intend to infringe upon, any trademarks, copyrights, logos, brand names, or other intellectual property mentioned or depicted on this site. Such intellectual property remains the property of its respective owners, and any references here are made solely for identification or informational purposes, without implying any affiliation, endorsement, or partnership.
We make no representations or warranties, express or implied, regarding the accuracy, completeness, or suitability of any content or products presented. Nothing on this website should be construed as legal, tax, investment, financial, medical, or other professional advice. In addition, no part of this site—including articles or product references—constitutes a solicitation, recommendation, endorsement, advertisement, or offer to buy or sell any securities, franchises, or other financial instruments, particularly in jurisdictions where such activity would be unlawful.
All content is of a general nature and may not address the specific circumstances of any individual or entity. It is not a substitute for professional advice or services. Any actions you take based on the information provided here are strictly at your own risk. You accept full responsibility for any decisions or outcomes arising from your use of this website and agree to release us from any liability in connection with your use of, or reliance upon, the content or products found herein.