
|
CME Group Inc. (CME) DCF تقييم |
Fully Editable: Tailor To Your Needs In Excel Or Sheets
Professional Design: Trusted, Industry-Standard Templates
Investor-Approved Valuation Models
MAC/PC Compatible, Fully Unlocked
No Expertise Is Needed; Easy To Follow
CME Group Inc. (CME) Bundle
تبسيط تقييم CME Group Inc. (CME) مع هذه الآلة الحاسبة DCF القابلة للتخصيص! يضم DEAR CME Group Inc. (CME) ماليات ومدخلات للتوقعات القابلة للتعديل ، يمكنك اختبار السيناريوهات وكشف القيمة العادلة CME Group Inc. (CME) في دقائق.
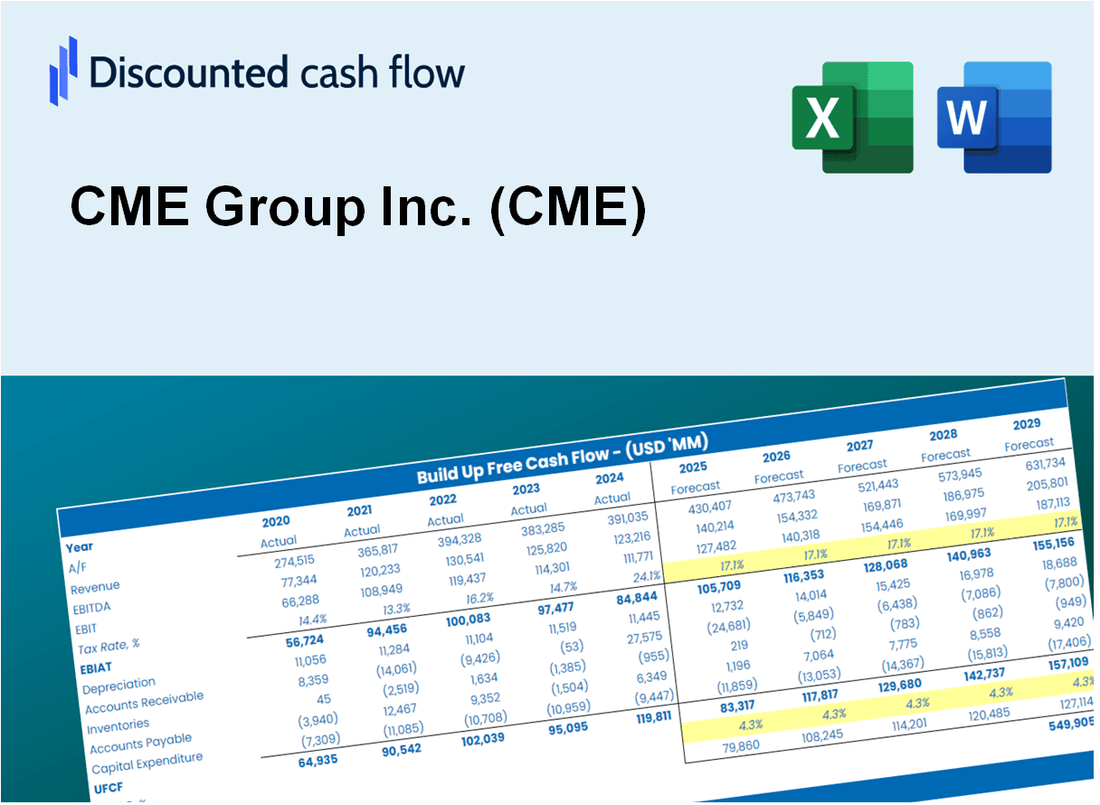
Discounted Cash Flow (DCF) - (USD MM)
| Year | AY1 2020 |
AY2 2021 |
AY3 2022 |
AY4 2023 |
AY5 2024 |
FY1 2025 |
FY2 2026 |
FY3 2027 |
FY4 2028 |
FY5 2029 |
|---|---|---|---|---|---|---|---|---|---|---|
| Revenue | 4,883.6 | 4,689.7 | 5,019.4 | 5,578.9 | 6,130.1 | 6,499.2 | 6,890.6 | 7,305.5 | 7,745.4 | 8,211.8 |
| Revenue Growth, % | 0 | -3.97 | 7.03 | 11.15 | 9.88 | 6.02 | 6.02 | 6.02 | 6.02 | 6.02 |
| EBITDA | 3,352.7 | 3,925.9 | 4,015.6 | 4,665.6 | 5,039.1 | 5,176.0 | 5,487.7 | 5,818.1 | 6,168.5 | 6,539.9 |
| EBITDA, % | 68.65 | 83.71 | 80 | 83.63 | 82.2 | 79.64 | 79.64 | 79.64 | 79.64 | 79.64 |
| Depreciation | 464.4 | 385.4 | 362.6 | 352.6 | 336.8 | 477.9 | 506.7 | 537.2 | 569.5 | 603.8 |
| Depreciation, % | 9.51 | 8.22 | 7.22 | 6.32 | 5.49 | 7.35 | 7.35 | 7.35 | 7.35 | 7.35 |
| EBIT | 2,888.3 | 3,540.5 | 3,653.0 | 4,313.0 | 4,702.3 | 4,698.1 | 4,981.0 | 5,280.9 | 5,598.9 | 5,936.1 |
| EBIT, % | 59.14 | 75.5 | 72.78 | 77.31 | 76.71 | 72.29 | 72.29 | 72.29 | 72.29 | 72.29 |
| Total Cash | 1,734.1 | 2,949.9 | 2,816.1 | 3,023.7 | 3,005.6 | 3,350.3 | 3,552.0 | 3,765.9 | 3,992.7 | 4,233.1 |
| Total Cash, percent | .0 | .0 | .0 | .0 | .0 | .0 | .0 | .0 | .0 | .0 |
| Account Receivables | 461.3 | 434.5 | 483.2 | 535.6 | 573.1 | 614.7 | 651.7 | 690.9 | 732.5 | 776.6 |
| Account Receivables, % | 9.45 | 9.26 | 9.63 | 9.6 | 9.35 | 9.46 | 9.46 | 9.46 | 9.46 | 9.46 |
| Inventories | .0 | .0 | .0 | .0 | .0 | .0 | .0 | .0 | .0 | .0 |
| Inventories, % | 0 | 0 | 0 | 0 | 0 | 0 | 0 | 0 | 0 | 0 |
| Accounts Payable | 69.3 | 48.8 | 121.4 | 90.6 | 79.9 | 101.5 | 107.6 | 114.0 | 120.9 | 128.2 |
| Accounts Payable, % | 1.42 | 1.04 | 2.42 | 1.62 | 1.3 | 1.56 | 1.56 | 1.56 | 1.56 | 1.56 |
| Capital Expenditure | -197.5 | -127.2 | -89.7 | -76.4 | -94.0 | -148.8 | -157.7 | -167.2 | -177.3 | -188.0 |
| Capital Expenditure, % | -4.04 | -2.71 | -1.79 | -1.37 | -1.53 | -2.29 | -2.29 | -2.29 | -2.29 | -2.29 |
| Tax Rate, % | 22.36 | 22.36 | 22.36 | 22.36 | 22.36 | 22.36 | 22.36 | 22.36 | 22.36 | 22.36 |
| EBITAT | 2,233.7 | 2,766.8 | 2,816.4 | 3,350.0 | 3,650.7 | 3,644.7 | 3,864.2 | 4,096.9 | 4,343.6 | 4,605.1 |
| Depreciation | ||||||||||
| Changes in Account Receivables | ||||||||||
| Changes in Inventories | ||||||||||
| Changes in Accounts Payable | ||||||||||
| Capital Expenditure | ||||||||||
| UFCF | 2,108.6 | 3,031.3 | 3,113.2 | 3,543.0 | 3,845.3 | 3,953.8 | 4,182.2 | 4,434.1 | 4,701.1 | 4,984.1 |
| WACC, % | 5.09 | 5.09 | 5.09 | 5.09 | 5.09 | 5.09 | 5.09 | 5.09 | 5.09 | 5.09 |
| PV UFCF | ||||||||||
| SUM PV UFCF | 19,110.7 | |||||||||
| Long Term Growth Rate, % | 2.00 | |||||||||
| Free cash flow (T + 1) | 5,084 | |||||||||
| Terminal Value | 164,348 | |||||||||
| Present Terminal Value | 128,200 | |||||||||
| Enterprise Value | 147,311 | |||||||||
| Net Debt | 536 | |||||||||
| Equity Value | 146,775 | |||||||||
| Diluted Shares Outstanding, MM | 360 | |||||||||
| Equity Value Per Share | 407.77 |
What You Will Get
- Real CME Data: Preloaded financials – from revenue to EBIT – based on actual and projected figures for CME Group Inc. (CME).
- Full Customization: Adjust all critical parameters (yellow cells) like WACC, growth %, and tax rates to fit CME's specific financial landscape.
- Instant Valuation Updates: Automatic recalculations to analyze the impact of changes on CME Group Inc.'s (CME) fair value.
- Versatile Excel Template: Tailored for quick edits, scenario testing, and detailed projections for CME Group Inc. (CME).
- Time-Saving and Accurate: Skip building models from scratch while maintaining precision and flexibility for CME Group Inc. (CME).
Key Features
- Comprehensive Market Data: Gain access to precise historical data and future forecasts for CME Group Inc. (CME).
- Adjustable Forecast Parameters: Modify highlighted fields such as WACC, growth rates, and profit margins.
- Real-Time Calculations: Automatic updates for DCF, Net Present Value (NPV), and cash flow evaluations.
- Interactive Dashboard: User-friendly charts and summaries to effectively present your valuation findings.
- Designed for Everyone: A straightforward, intuitive layout suitable for investors, CFOs, and consultants alike.
How It Works
- 1. Access the Template: Download and open the Excel file containing CME Group Inc.'s (CME) preloaded data.
- 2. Modify Assumptions: Adjust critical inputs such as growth rates, WACC, and capital expenditures.
- 3. View Results Instantly: The DCF model automatically computes intrinsic value and NPV.
- 4. Explore Scenarios: Analyze various forecasts to evaluate different valuation results.
- 5. Present with Assurance: Share professional valuation insights to enhance your decision-making process.
Why Choose This Calculator for CME Group Inc. (CME)?
- Designed for Experts: A sophisticated tool tailored for traders, analysts, and financial advisors.
- Comprehensive Data: CME Group’s historical and projected financials are preloaded for enhanced precision.
- Flexible Scenario Analysis: Easily simulate various market conditions and investment assumptions.
- Insightful Results: Automatically computes intrinsic value, NPV, and essential financial metrics.
- User-Friendly Interface: Step-by-step guidance ensures a smooth calculation experience.
Who Should Use CME Group Inc. (CME)?
- Traders: Enhance your trading strategies with advanced market insights and analytics.
- Institutional Investors: Utilize CME's robust platforms for efficient risk management and hedging.
- Financial Advisors: Leverage CME's resources to provide informed recommendations to clients.
- Market Researchers: Access comprehensive data and reports to support your analyses.
- Students and Educators: Explore practical applications of financial concepts through CME's educational offerings.
What the Template Contains
- Historical Data: Includes CME Group Inc.’s past financials and baseline forecasts.
- DCF and Levered DCF Models: Detailed templates to calculate CME Group Inc.’s intrinsic value.
- WACC Sheet: Pre-built calculations for Weighted Average Cost of Capital.
- Editable Inputs: Modify key drivers like growth rates, EBITDA %, and CAPEX assumptions.
- Quarterly and Annual Statements: A complete breakdown of CME Group Inc.’s financials.
- Interactive Dashboard: Visualize valuation results and projections dynamically.
Disclaimer
All information, articles, and product details provided on this website are for general informational and educational purposes only. We do not claim any ownership over, nor do we intend to infringe upon, any trademarks, copyrights, logos, brand names, or other intellectual property mentioned or depicted on this site. Such intellectual property remains the property of its respective owners, and any references here are made solely for identification or informational purposes, without implying any affiliation, endorsement, or partnership.
We make no representations or warranties, express or implied, regarding the accuracy, completeness, or suitability of any content or products presented. Nothing on this website should be construed as legal, tax, investment, financial, medical, or other professional advice. In addition, no part of this site—including articles or product references—constitutes a solicitation, recommendation, endorsement, advertisement, or offer to buy or sell any securities, franchises, or other financial instruments, particularly in jurisdictions where such activity would be unlawful.
All content is of a general nature and may not address the specific circumstances of any individual or entity. It is not a substitute for professional advice or services. Any actions you take based on the information provided here are strictly at your own risk. You accept full responsibility for any decisions or outcomes arising from your use of this website and agree to release us from any liability in connection with your use of, or reliance upon, the content or products found herein.