
|
CMS Energy Corporation (CMS) تقييم DCF |
Fully Editable: Tailor To Your Needs In Excel Or Sheets
Professional Design: Trusted, Industry-Standard Templates
Investor-Approved Valuation Models
MAC/PC Compatible, Fully Unlocked
No Expertise Is Needed; Easy To Follow
CMS Energy Corporation (CMS) Bundle
تقييم التوقعات المالية لشركة CMS Energy Corporation كخبير! توفر حاسبة DCF هذه (CMS) مالية مملوءة مسبقًا ومرونة كاملة لتعديل نمو الإيرادات ، WACC ، الهوامش ، وغيرها من الافتراضات الأساسية التي تتماشى مع تنبؤاتك.
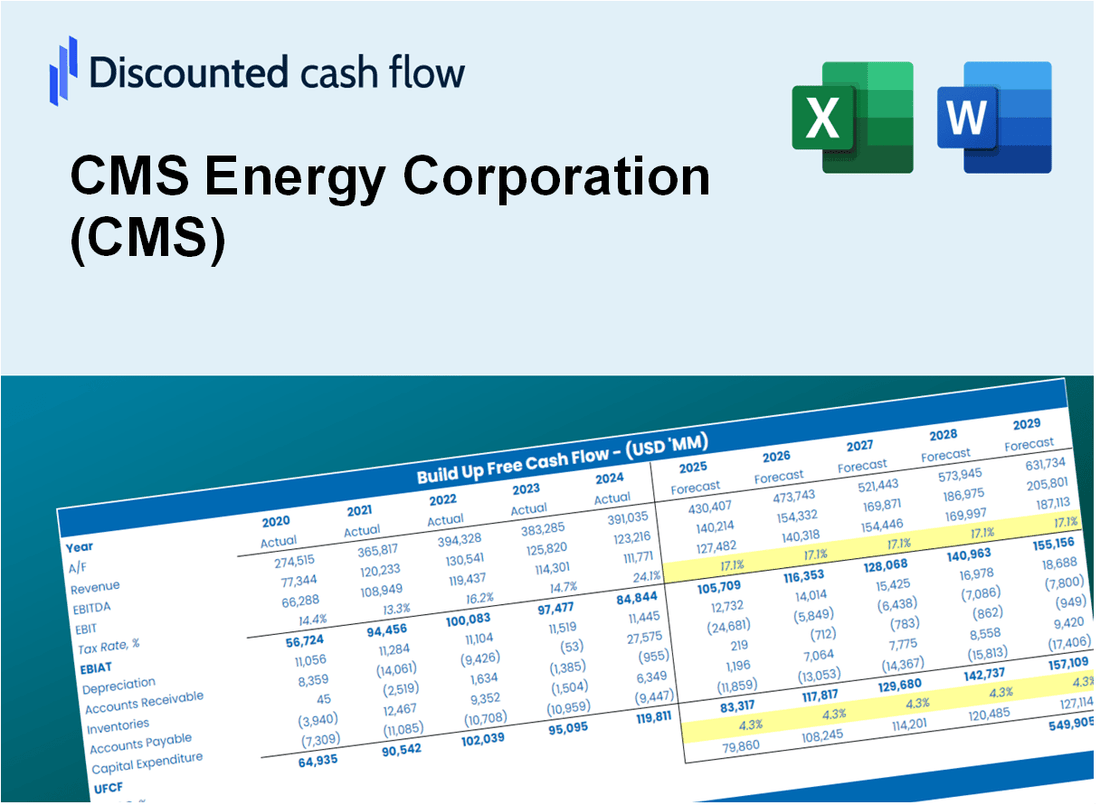
Discounted Cash Flow (DCF) - (USD MM)
| Year | AY1 2020 |
AY2 2021 |
AY3 2022 |
AY4 2023 |
AY5 2024 |
FY1 2025 |
FY2 2026 |
FY3 2027 |
FY4 2028 |
FY5 2029 |
|---|---|---|---|---|---|---|---|---|---|---|
| Revenue | 6,418.0 | 7,329.0 | 8,596.0 | 7,462.0 | 7,515.0 | 7,872.0 | 8,245.9 | 8,637.6 | 9,047.8 | 9,477.6 |
| Revenue Growth, % | 0 | 14.19 | 17.29 | -13.19 | 0.71027 | 4.75 | 4.75 | 4.75 | 4.75 | 4.75 |
| EBITDA | 2,357.0 | 2,437.0 | 2,547.0 | 2,777.0 | 3,071.0 | 2,797.5 | 2,930.4 | 3,069.6 | 3,215.4 | 3,368.1 |
| EBITDA, % | 36.72 | 33.25 | 29.63 | 37.22 | 40.86 | 35.54 | 35.54 | 35.54 | 35.54 | 35.54 |
| Depreciation | 1,043.0 | 1,114.0 | 1,126.0 | 1,180.0 | 1,240.0 | 1,210.1 | 1,267.6 | 1,327.8 | 1,390.9 | 1,457.0 |
| Depreciation, % | 16.25 | 15.2 | 13.1 | 15.81 | 16.5 | 15.37 | 15.37 | 15.37 | 15.37 | 15.37 |
| EBIT | 1,314.0 | 1,323.0 | 1,421.0 | 1,597.0 | 1,831.0 | 1,587.3 | 1,662.7 | 1,741.7 | 1,824.5 | 1,911.1 |
| EBIT, % | 20.47 | 18.05 | 16.53 | 21.4 | 24.36 | 20.16 | 20.16 | 20.16 | 20.16 | 20.16 |
| Total Cash | 32.0 | 452.0 | 164.0 | 227.0 | 103.0 | 204.5 | 214.2 | 224.3 | 235.0 | 246.2 |
| Total Cash, percent | .0 | .0 | .0 | .0 | .0 | .0 | .0 | .0 | .0 | .0 |
| Account Receivables | 872.0 | 943.0 | 1,580.0 | 944.0 | 1,063.0 | 1,127.7 | 1,181.3 | 1,237.4 | 1,296.2 | 1,357.8 |
| Account Receivables, % | 13.59 | 12.87 | 18.38 | 12.65 | 14.15 | 14.33 | 14.33 | 14.33 | 14.33 | 14.33 |
| Inventories | 576.0 | 667.0 | 1,117.0 | 938.0 | 769.0 | 848.2 | 888.5 | 930.7 | 974.9 | 1,021.2 |
| Inventories, % | 8.97 | 9.1 | 12.99 | 12.57 | 10.23 | 10.77 | 10.77 | 10.77 | 10.77 | 10.77 |
| Accounts Payable | 668.0 | 886.0 | 936.0 | 809.0 | 1,093.0 | 925.3 | 969.3 | 1,015.3 | 1,063.5 | 1,114.0 |
| Accounts Payable, % | 10.41 | 12.09 | 10.89 | 10.84 | 14.54 | 11.75 | 11.75 | 11.75 | 11.75 | 11.75 |
| Capital Expenditure | -2,311.0 | -2,076.0 | -2,374.0 | -3,219.0 | -3,018.0 | -2,759.1 | -2,890.2 | -3,027.5 | -3,171.3 | -3,321.9 |
| Capital Expenditure, % | -36.01 | -28.33 | -27.62 | -43.14 | -40.16 | -35.05 | -35.05 | -35.05 | -35.05 | -35.05 |
| Tax Rate, % | 10.69 | 10.69 | 10.69 | 10.69 | 10.69 | 10.69 | 10.69 | 10.69 | 10.69 | 10.69 |
| EBITAT | 1,226.3 | 2,175.0 | 1,318.6 | 1,484.8 | 1,635.3 | 1,487.1 | 1,557.7 | 1,631.7 | 1,709.2 | 1,790.4 |
| Depreciation | ||||||||||
| Changes in Account Receivables | ||||||||||
| Changes in Inventories | ||||||||||
| Changes in Accounts Payable | ||||||||||
| Capital Expenditure | ||||||||||
| UFCF | -821.7 | 1,269.0 | -966.4 | 133.8 | 191.3 | -373.5 | -114.8 | -120.2 | -125.9 | -131.9 |
| WACC, % | 5.12 | 5.24 | 5.11 | 5.11 | 5.05 | 5.13 | 5.13 | 5.13 | 5.13 | 5.13 |
| PV UFCF | ||||||||||
| SUM PV UFCF | -768.5 | |||||||||
| Long Term Growth Rate, % | 3.00 | |||||||||
| Free cash flow (T + 1) | -136 | |||||||||
| Terminal Value | -6,386 | |||||||||
| Present Terminal Value | -4,973 | |||||||||
| Enterprise Value | -5,742 | |||||||||
| Net Debt | 16,487 | |||||||||
| Equity Value | -22,229 | |||||||||
| Diluted Shares Outstanding, MM | 298 | |||||||||
| Equity Value Per Share | -74.52 |
What You Will Get
- Real CMS Financials: Access to historical and projected data for precise valuation.
- Customizable Inputs: Adjust WACC, tax rates, revenue growth, and capital expenditures as needed.
- Automated Calculations: Intrinsic value and NPV are computed in real-time.
- Scenario Analysis: Evaluate various scenarios to assess CMS Energy's future performance.
- User-Friendly Design: Designed for professionals while remaining accessible to newcomers.
Key Features
- Comprehensive CMS Data: Pre-loaded with CMS Energy Corporation's historical performance metrics and future outlook.
- Customizable Assumptions: Modify inputs such as revenue growth rates, operating margins, discount rates, tax implications, and capital investments.
- Interactive Valuation Framework: Real-time adjustments to Net Present Value (NPV) and intrinsic valuation based on user-defined parameters.
- Multiple Scenario Analysis: Develop various forecasting scenarios to explore diverse valuation possibilities.
- Intuitive User Interface: Designed to be accessible for both industry professionals and newcomers.
How It Works
- Step 1: Download the Excel file for CMS Energy Corporation (CMS).
- Step 2: Review CMS's pre-filled financial data and forecasts.
- Step 3: Modify key inputs such as revenue growth, WACC, and tax rates (highlighted cells).
- Step 4: Observe the DCF model update in real-time as you adjust your assumptions.
- Step 5: Analyze the results and leverage them for informed investment decisions.
Why Choose This Calculator for CMS Energy Corporation (CMS)?
- User-Friendly Interface: Perfectly crafted for both novice users and seasoned professionals.
- Customizable Inputs: Adjust parameters easily to suit your specific analysis needs.
- Real-Time Adjustments: Watch as CMS Energy's valuation updates instantly with your input changes.
- Preloaded Financial Data: Comes equipped with CMS Energy's actual financial metrics for streamlined analysis.
- Preferred by Industry Experts: Valued by investors and analysts for making well-informed decisions.
Who Should Use CMS Energy Corporation (CMS)?
- Investors: Gain insights and make informed decisions with a robust valuation tool tailored for CMS.
- Financial Analysts: Streamline your analysis process with a customizable DCF model specifically for CMS.
- Consultants: Effortlessly modify the template for client reports or presentations focused on CMS.
- Energy Sector Enthusiasts: Enhance your knowledge of valuation strategies using CMS as a case study.
- Educators and Students: Utilize it as a hands-on resource in courses related to finance and energy markets.
What the Template Contains
- Pre-Filled Data: Includes CMS Energy Corporation’s historical financials and forecasts.
- Discounted Cash Flow Model: Editable DCF valuation model with automatic calculations.
- Weighted Average Cost of Capital (WACC): A dedicated sheet for calculating WACC based on custom inputs.
- Key Financial Ratios: Analyze CMS Energy Corporation’s profitability, efficiency, and leverage.
- Customizable Inputs: Edit revenue growth, margins, and tax rates with ease.
- Clear Dashboard: Charts and tables summarizing key valuation results.
Disclaimer
All information, articles, and product details provided on this website are for general informational and educational purposes only. We do not claim any ownership over, nor do we intend to infringe upon, any trademarks, copyrights, logos, brand names, or other intellectual property mentioned or depicted on this site. Such intellectual property remains the property of its respective owners, and any references here are made solely for identification or informational purposes, without implying any affiliation, endorsement, or partnership.
We make no representations or warranties, express or implied, regarding the accuracy, completeness, or suitability of any content or products presented. Nothing on this website should be construed as legal, tax, investment, financial, medical, or other professional advice. In addition, no part of this site—including articles or product references—constitutes a solicitation, recommendation, endorsement, advertisement, or offer to buy or sell any securities, franchises, or other financial instruments, particularly in jurisdictions where such activity would be unlawful.
All content is of a general nature and may not address the specific circumstances of any individual or entity. It is not a substitute for professional advice or services. Any actions you take based on the information provided here are strictly at your own risk. You accept full responsibility for any decisions or outcomes arising from your use of this website and agree to release us from any liability in connection with your use of, or reliance upon, the content or products found herein.