
|
CNFinance Holdings Limited (CNF) تقييم DCF |
Fully Editable: Tailor To Your Needs In Excel Or Sheets
Professional Design: Trusted, Industry-Standard Templates
Investor-Approved Valuation Models
MAC/PC Compatible, Fully Unlocked
No Expertise Is Needed; Easy To Follow
CNFinance Holdings Limited (CNF) Bundle
تبحث لتقييم القيمة الجوهرية لـ CNFinance Holdings Limited؟ يدمج حاسبة CNF DCF الخاصة بنا البيانات الواقعية مع ميزات تخصيص واسعة ، مما يتيح لك تحسين توقعاتك واتخاذ المزيد من خيارات الاستثمار المستنيرة.
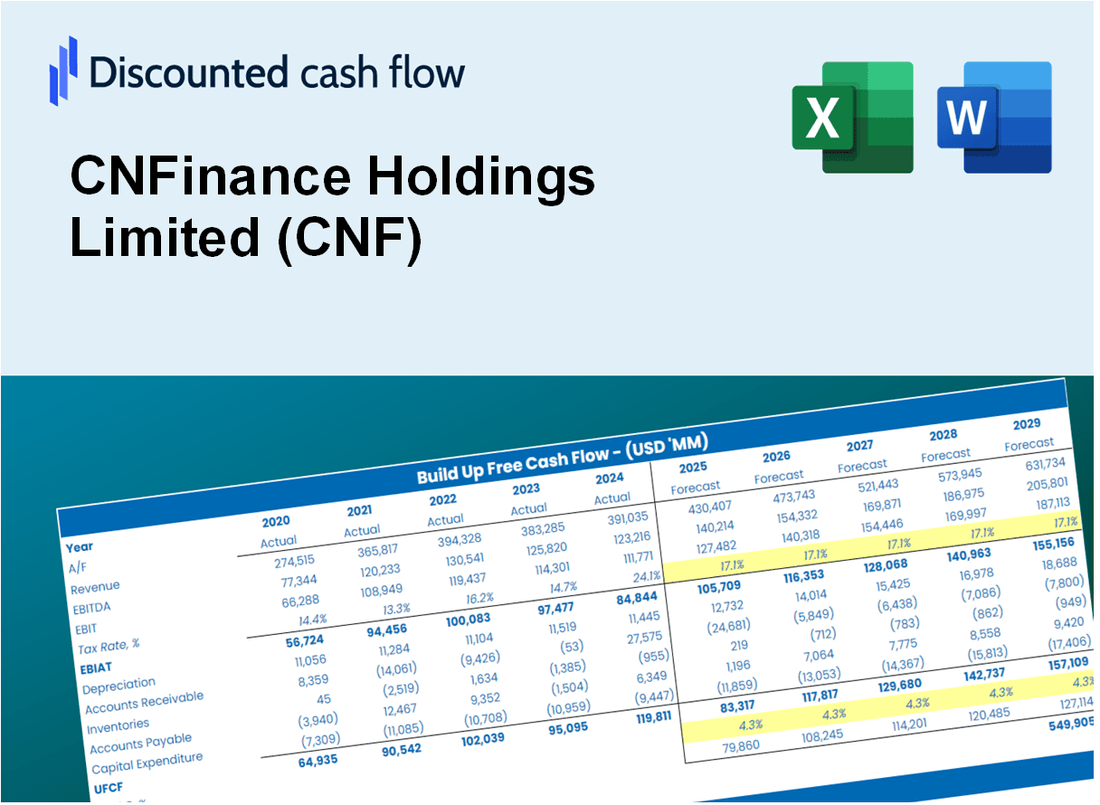
Discounted Cash Flow (DCF) - (USD MM)
| Year | AY1 2020 |
AY2 2021 |
AY3 2022 |
AY4 2023 |
AY5 2024 |
FY1 2025 |
FY2 2026 |
FY3 2027 |
FY4 2028 |
FY5 2029 |
|---|---|---|---|---|---|---|---|---|---|---|
| Revenue | 142.9 | 124.6 | 259.1 | 258.8 | 224.8 | 266.3 | 315.6 | 373.9 | 443.0 | 524.9 |
| Revenue Growth, % | 0 | -12.8 | 107.89 | -0.10271 | -13.15 | 18.49 | 18.49 | 18.49 | 18.49 | 18.49 |
| EBITDA | .0 | 13.7 | 24.6 | 29.1 | 8.4 | 18.9 | 22.4 | 26.5 | 31.4 | 37.2 |
| EBITDA, % | 0 | 11 | 9.48 | 11.26 | 3.74 | 7.1 | 7.1 | 7.1 | 7.1 | 7.1 |
| Depreciation | .8 | .5 | .3 | .2 | 1.6 | 1.0 | 1.2 | 1.5 | 1.7 | 2.1 |
| Depreciation, % | 0.5944 | 0.4308 | 0.12169 | 0.09514935 | 0.72124 | 0.39266 | 0.39266 | 0.39266 | 0.39266 | 0.39266 |
| EBIT | -.8 | 13.2 | 24.2 | 28.9 | 6.8 | 17.9 | 21.2 | 25.1 | 29.7 | 35.2 |
| EBIT, % | -0.5944 | 10.57 | 9.36 | 11.16 | 3.02 | 6.7 | 6.7 | 6.7 | 6.7 | 6.7 |
| Total Cash | 350.2 | 488.3 | 2,303,904.0 | 378.8 | 252.1 | 266.3 | 315.6 | 373.9 | 443.0 | 524.9 |
| Total Cash, percent | .0 | .0 | .9 | .0 | .0 | .0 | .0 | .0 | .0 | .0 |
| Account Receivables | 5.3 | 38.2 | 35.3 | 80.4 | 140.9 | 75.5 | 89.5 | 106.0 | 125.6 | 148.8 |
| Account Receivables, % | 3.69 | 30.67 | 13.63 | 31.06 | 62.69 | 28.35 | 28.35 | 28.35 | 28.35 | 28.35 |
| Inventories | .0 | .0 | .0 | .0 | .0 | .0 | .0 | .0 | .0 | .0 |
| Inventories, % | 0 | 0 | 0 | 0 | 0 | 0 | 0 | 0 | 0 | 0 |
| Accounts Payable | .0 | .0 | .0 | .0 | .0 | .0 | .0 | .0 | .0 | .0 |
| Accounts Payable, % | 0 | 0 | 0 | 0 | 0 | 0 | 0 | 0 | 0 | 0 |
| Capital Expenditure | -.5 | -.5 | -12.6 | -16.1 | -1.1 | -6.6 | -7.8 | -9.2 | -10.9 | -12.9 |
| Capital Expenditure, % | -0.31664 | -0.429 | -4.87 | -6.21 | -0.49657 | -2.47 | -2.47 | -2.47 | -2.47 | -2.47 |
| Tax Rate, % | 21.75 | 21.75 | 21.75 | 21.75 | 21.75 | 21.75 | 21.75 | 21.75 | 21.75 | 21.75 |
| EBITAT | -.6 | 9.2 | 19.0 | 23.1 | 5.3 | 13.5 | 15.9 | 18.9 | 22.4 | 26.5 |
| Depreciation | ||||||||||
| Changes in Account Receivables | ||||||||||
| Changes in Inventories | ||||||||||
| Changes in Accounts Payable | ||||||||||
| Capital Expenditure | ||||||||||
| UFCF | -5.5 | -23.8 | 9.6 | -37.8 | -54.7 | 73.4 | -4.6 | -5.4 | -6.4 | -7.6 |
| WACC, % | 9.41 | 9.27 | 10.46 | 10.68 | 10.43 | 10.05 | 10.05 | 10.05 | 10.05 | 10.05 |
| PV UFCF | ||||||||||
| SUM PV UFCF | 49.8 | |||||||||
| Long Term Growth Rate, % | 2.00 | |||||||||
| Free cash flow (T + 1) | -8 | |||||||||
| Terminal Value | -96 | |||||||||
| Present Terminal Value | -60 | |||||||||
| Enterprise Value | -10 | |||||||||
| Net Debt | 590 | |||||||||
| Equity Value | -600 | |||||||||
| Diluted Shares Outstanding, MM | 0 | |||||||||
| Equity Value Per Share | -3,496.99 |
What You Will Receive
- Adjustable Forecast Inputs: Effortlessly modify key assumptions (growth %, margins, WACC) to explore various scenarios.
- Current Market Data: CNFinance Holdings Limited’s financial data pre-loaded to facilitate your analysis.
- Instant DCF Outputs: The template automatically computes Net Present Value (NPV) and intrinsic value for your convenience.
- Tailored and Professional: A sophisticated Excel model that meets your valuation requirements.
- Designed for Analysts and Investors: Perfect for evaluating projections, confirming strategies, and enhancing efficiency.
Key Features
- Pre-Loaded Data: CNFinance Holdings Limited’s historical financial statements and pre-filled forecasts.
- Fully Adjustable Inputs: Edit WACC, tax rates, revenue growth, and EBITDA margins.
- Instant Results: See CNFinance Holdings Limited’s intrinsic value recalculate in real time.
- Clear Visual Outputs: Dashboard charts display valuation results and key metrics.
- Built for Accuracy: A professional tool for analysts, investors, and finance experts.
How It Works
- Download the Template: Gain immediate access to the Excel-based CNF DCF Calculator.
- Input Your Assumptions: Modify the yellow-highlighted cells for growth rates, WACC, margins, and other variables.
- Instant Calculations: The model automatically recalculates CNFinance's intrinsic value.
- Test Scenarios: Explore various assumptions to assess potential changes in valuation.
- Analyze and Decide: Leverage the results to inform your investment or financial strategies.
Why Choose CNFinance Holdings Limited (CNF) Calculator?
- Precision: Utilizes authentic CNFinance financial data to ensure accuracy.
- Versatility: Built for users to explore and adjust inputs without restrictions.
- Efficiency: Avoid the complexities of constructing a financial model from the ground up.
- Expert-Level: Crafted with the expertise and usability expected at the CFO level.
- Intuitive: Simple to navigate, making it accessible for users without extensive financial modeling skills.
Who Should Use This Product?
- Finance Students: Master financial modeling and apply it to real-world scenarios using CNFinance data.
- Academics: Utilize industry-standard valuation models in your teaching and research involving CNF.
- Investors: Evaluate your investment strategies and assess valuation metrics for CNFinance Holdings Limited (CNF).
- Analysts: Enhance your analysis with a customizable DCF model tailored for CNF.
- Small Business Owners: Understand the valuation methods used for analyzing companies like CNFinance Holdings Limited (CNF).
What the Template Contains
- Operating and Balance Sheet Data: Pre-filled CNFinance Holdings Limited (CNF) historical data and forecasts, including revenue, EBITDA, EBIT, and capital expenditures.
- WACC Calculation: A dedicated sheet for Weighted Average Cost of Capital (WACC), including parameters like Beta, risk-free rate, and share price.
- DCF Valuation (Unlevered and Levered): Editable Discounted Cash Flow models showing intrinsic value with detailed calculations.
- Financial Statements: Pre-loaded financial statements (annual and quarterly) to support analysis.
- Key Ratios: Includes profitability, leverage, and efficiency ratios for CNFinance Holdings Limited (CNF).
- Dashboard and Charts: Visual summary of valuation outputs and assumptions to analyze results easily.
Disclaimer
All information, articles, and product details provided on this website are for general informational and educational purposes only. We do not claim any ownership over, nor do we intend to infringe upon, any trademarks, copyrights, logos, brand names, or other intellectual property mentioned or depicted on this site. Such intellectual property remains the property of its respective owners, and any references here are made solely for identification or informational purposes, without implying any affiliation, endorsement, or partnership.
We make no representations or warranties, express or implied, regarding the accuracy, completeness, or suitability of any content or products presented. Nothing on this website should be construed as legal, tax, investment, financial, medical, or other professional advice. In addition, no part of this site—including articles or product references—constitutes a solicitation, recommendation, endorsement, advertisement, or offer to buy or sell any securities, franchises, or other financial instruments, particularly in jurisdictions where such activity would be unlawful.
All content is of a general nature and may not address the specific circumstances of any individual or entity. It is not a substitute for professional advice or services. Any actions you take based on the information provided here are strictly at your own risk. You accept full responsibility for any decisions or outcomes arising from your use of this website and agree to release us from any liability in connection with your use of, or reliance upon, the content or products found herein.