
|
كوهين & شركة Inc. (COHN) تقييم DCF |
Fully Editable: Tailor To Your Needs In Excel Or Sheets
Professional Design: Trusted, Industry-Standard Templates
Investor-Approved Valuation Models
MAC/PC Compatible, Fully Unlocked
No Expertise Is Needed; Easy To Follow
Cohen & Company Inc. (COHN) Bundle
تبسيط كوهين & Company Inc. (COHN) تقييم مع هذه الآلة الحاسبة DCF القابلة للتخصيص! مزود بكوهين دقيق & Company Inc. (Cohn) Financial ومدخلات التنبؤات المرنة ، يمكنك استكشاف السيناريوهات والكشف عن كوهين & شركة الشركة (COHN) القيمة العادلة في دقائق فقط.
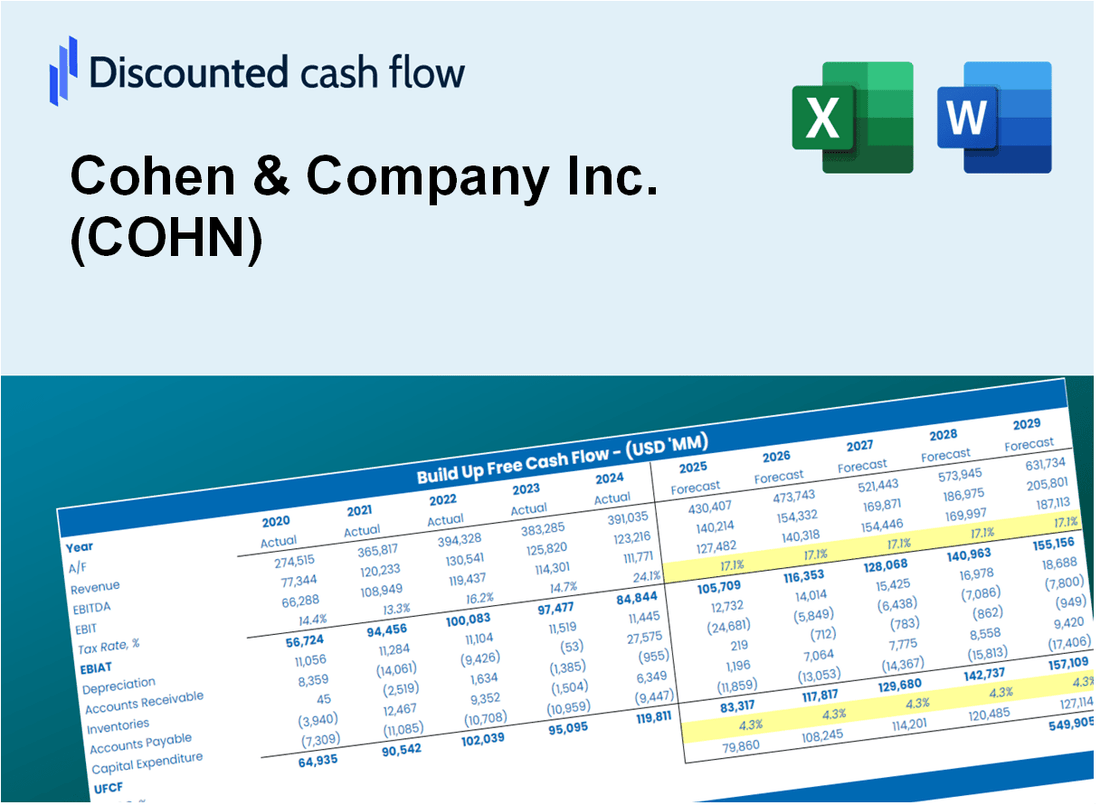
Discounted Cash Flow (DCF) - (USD MM)
| Year | AY1 2020 |
AY2 2021 |
AY3 2022 |
AY4 2023 |
AY5 2024 |
FY1 2025 |
FY2 2026 |
FY3 2027 |
FY4 2028 |
FY5 2029 |
|---|---|---|---|---|---|---|---|---|---|---|
| Revenue | 130.1 | 146.4 | 44.4 | 83.0 | 79.6 | 84.7 | 90.2 | 95.9 | 102.1 | 108.7 |
| Revenue Growth, % | 0 | 12.5 | -69.67 | 86.95 | -4.08 | 6.42 | 6.42 | 6.42 | 6.42 | 6.42 |
| EBITDA | 39.8 | 78.1 | -48.3 | 23.0 | 2.6 | 2.5 | 2.7 | 2.9 | 3.1 | 3.3 |
| EBITDA, % | 30.6 | 53.36 | -108.9 | 27.76 | 3.26 | 3 | 3 | 3 | 3 | 3 |
| Depreciation | .3 | .4 | .6 | .6 | .6 | .5 | .6 | .6 | .6 | .7 |
| Depreciation, % | 0.25671 | 0.25347 | 1.25 | 0.67847 | 0.69851 | 0.62841 | 0.62841 | 0.62841 | 0.62841 | 0.62841 |
| EBIT | 39.5 | 77.7 | -48.9 | 22.5 | 2.0 | 2.2 | 2.4 | 2.5 | 2.7 | 2.8 |
| EBIT, % | 30.34 | 53.11 | -110.15 | 27.08 | 2.56 | 2.62 | 2.62 | 2.62 | 2.62 | 2.62 |
| Total Cash | 285.0 | 273.2 | 236.3 | 181.4 | 163.1 | 84.7 | 90.2 | 95.9 | 102.1 | 108.7 |
| Total Cash, percent | .0 | .0 | .0 | .0 | .0 | .0 | .0 | .0 | .0 | .0 |
| Account Receivables | 5,772.7 | 3,251.6 | 584.4 | 484.2 | 721.1 | 84.7 | 90.2 | 95.9 | 102.1 | 108.7 |
| Account Receivables, % | 4436.8 | 2221.5 | 1316.57 | 583.53 | 905.96 | 100 | 100 | 100 | 100 | 100 |
| Inventories | .0 | .0 | .0 | .0 | .0 | .0 | .0 | .0 | .0 | .0 |
| Inventories, % | 0 | 0 | 0 | 0 | 0 | 0 | 0 | 0 | 0 | 0 |
| Accounts Payable | .2 | .1 | 4.1 | 1.2 | .8 | 2.0 | 2.2 | 2.3 | 2.4 | 2.6 |
| Accounts Payable, % | 0.12451 | 0.08335155 | 9.3 | 1.42 | 1.02 | 2.39 | 2.39 | 2.39 | 2.39 | 2.39 |
| Capital Expenditure | -.2 | -1.0 | -.6 | -.4 | -1.2 | -.7 | -.8 | -.8 | -.9 | -.9 |
| Capital Expenditure, % | -0.16678 | -0.70234 | -1.29 | -0.4495 | -1.57 | -0.83574 | -0.83574 | -0.83574 | -0.83574 | -0.83574 |
| Tax Rate, % | 101.64 | 101.64 | 101.64 | 101.64 | 101.64 | 101.64 | 101.64 | 101.64 | 101.64 | 101.64 |
| EBITAT | 18.8 | 13.0 | -12.2 | -7.2 | .0 | .4 | .4 | .4 | .5 | .5 |
| Depreciation | ||||||||||
| Changes in Account Receivables | ||||||||||
| Changes in Inventories | ||||||||||
| Changes in Accounts Payable | ||||||||||
| Capital Expenditure | ||||||||||
| UFCF | -5,753.6 | 2,533.5 | 2,659.0 | 90.2 | -238.0 | 637.8 | -5.1 | -5.4 | -5.7 | -6.1 |
| WACC, % | 5.32 | 4.41 | 4.65 | 3.91 | 3.91 | 4.44 | 4.44 | 4.44 | 4.44 | 4.44 |
| PV UFCF | ||||||||||
| SUM PV UFCF | 591.6 | |||||||||
| Long Term Growth Rate, % | 2.00 | |||||||||
| Free cash flow (T + 1) | -6 | |||||||||
| Terminal Value | -256 | |||||||||
| Present Terminal Value | -206 | |||||||||
| Enterprise Value | 386 | |||||||||
| Net Debt | 99 | |||||||||
| Equity Value | 287 | |||||||||
| Diluted Shares Outstanding, MM | 6 | |||||||||
| Equity Value Per Share | 50.63 |
What You Will Get
- Real COHN Financial Data: Pre-filled with Cohen & Company Inc.’s historical and projected data for precise analysis.
- Fully Editable Template: Modify key inputs like revenue growth, WACC, and EBITDA % with ease.
- Automatic Calculations: See Cohen & Company Inc.’s intrinsic value update instantly based on your changes.
- Professional Valuation Tool: Designed for investors, analysts, and consultants seeking accurate DCF results.
- User-Friendly Design: Simple structure and clear instructions for all experience levels.
Key Features
- 🔍 Real-Life COHN Financials: Pre-filled historical and projected data for Cohen & Company Inc.
- ✏️ Fully Customizable Inputs: Adjust all critical parameters (yellow cells) like WACC, growth %, and tax rates.
- 📊 Professional DCF Valuation: Built-in formulas calculate Cohen’s intrinsic value using the Discounted Cash Flow method.
- ⚡ Instant Results: Visualize Cohen’s valuation instantly after making changes.
- Scenario Analysis: Test and compare outcomes for various financial assumptions side-by-side.
How It Works
- Download the Template: Gain immediate access to the Excel-based COHN DCF Calculator.
- Input Your Assumptions: Modify the yellow-highlighted cells for growth rates, WACC, margins, and other variables.
- Instant Calculations: The model automatically recalculates Cohen & Company Inc.'s intrinsic value.
- Test Scenarios: Experiment with different assumptions to assess potential changes in valuation.
- Analyze and Decide: Utilize the results to inform your investment or financial analysis.
Why Choose Cohen & Company Inc. (COHN)?
- Save Time: Access pre-built financial models without the hassle of starting from scratch.
- Enhance Accuracy: Utilize trusted financial data and formulas to minimize valuation errors.
- Completely Customizable: Adjust the models to align with your specific assumptions and forecasts.
- User-Friendly: Intuitive charts and outputs simplify the analysis of results.
- Endorsed by Professionals: Crafted for experts who prioritize both precision and functionality.
Who Should Use This Product?
- Investors: Accurately assess the fair value of Cohen & Company Inc. (COHN) prior to making investment choices.
- CFOs: Utilize a high-quality DCF model for thorough financial reporting and analysis.
- Consultants: Efficiently customize the template for client valuation reports.
- Entrepreneurs: Acquire knowledge on financial modeling practices employed by leading firms.
- Educators: Implement it as a resource to illustrate valuation techniques in the classroom.
What the Template Contains
- Operating and Balance Sheet Data: Pre-filled Cohen & Company Inc. (COHN) historical data and forecasts, including revenue, EBITDA, EBIT, and capital expenditures.
- WACC Calculation: A dedicated sheet for Weighted Average Cost of Capital (WACC), featuring parameters like Beta, risk-free rate, and share price.
- DCF Valuation (Unlevered and Levered): Editable Discounted Cash Flow models illustrating intrinsic value with detailed calculations.
- Financial Statements: Pre-loaded financial statements (annual and quarterly) to support analysis for Cohen & Company Inc. (COHN).
- Key Ratios: Includes profitability, leverage, and efficiency ratios specific to Cohen & Company Inc. (COHN).
- Dashboard and Charts: Visual summary of valuation outputs and assumptions to facilitate easy analysis of results.
Disclaimer
All information, articles, and product details provided on this website are for general informational and educational purposes only. We do not claim any ownership over, nor do we intend to infringe upon, any trademarks, copyrights, logos, brand names, or other intellectual property mentioned or depicted on this site. Such intellectual property remains the property of its respective owners, and any references here are made solely for identification or informational purposes, without implying any affiliation, endorsement, or partnership.
We make no representations or warranties, express or implied, regarding the accuracy, completeness, or suitability of any content or products presented. Nothing on this website should be construed as legal, tax, investment, financial, medical, or other professional advice. In addition, no part of this site—including articles or product references—constitutes a solicitation, recommendation, endorsement, advertisement, or offer to buy or sell any securities, franchises, or other financial instruments, particularly in jurisdictions where such activity would be unlawful.
All content is of a general nature and may not address the specific circumstances of any individual or entity. It is not a substitute for professional advice or services. Any actions you take based on the information provided here are strictly at your own risk. You accept full responsibility for any decisions or outcomes arising from your use of this website and agree to release us from any liability in connection with your use of, or reliance upon, the content or products found herein.