
|
Copa Holdings، S.A. (CPA) تقييم DCF |
Fully Editable: Tailor To Your Needs In Excel Or Sheets
Professional Design: Trusted, Industry-Standard Templates
Investor-Approved Valuation Models
MAC/PC Compatible, Fully Unlocked
No Expertise Is Needed; Easy To Follow
Copa Holdings, S.A. (CPA) Bundle
عزز استراتيجية الاستثمار الخاصة بك مع حاسبة (CPA) DCF! استكشف البيانات المالية الحقيقية لـ COPA Holdings ، وضبط توقعات النمو والنفقات ، ومراقبة على الفور كيف تؤثر هذه التغييرات على القيمة الجوهرية لـ (CPA).
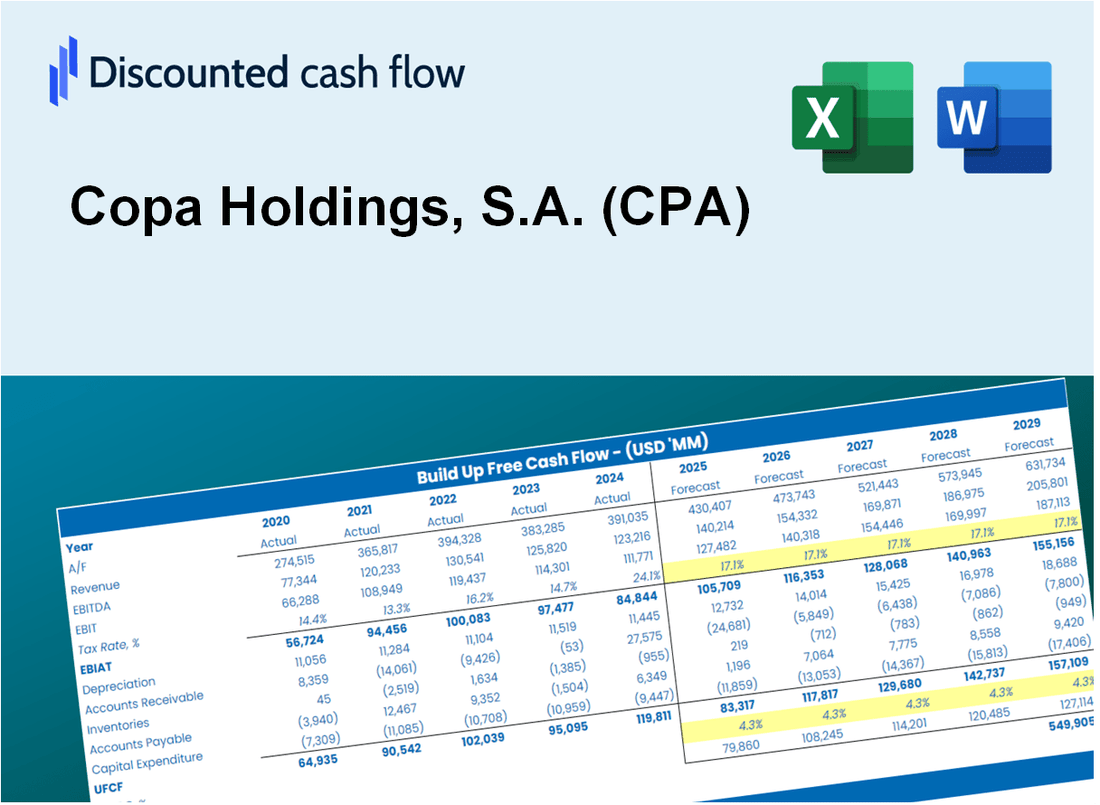
Discounted Cash Flow (DCF) - (USD MM)
| Year | AY1 2020 |
AY2 2021 |
AY3 2022 |
AY4 2023 |
AY5 2024 |
FY1 2025 |
FY2 2026 |
FY3 2027 |
FY4 2028 |
FY5 2029 |
|---|---|---|---|---|---|---|---|---|---|---|
| Revenue | 801.0 | 1,509.9 | 2,965.0 | 3,457.0 | 3,446.2 | 3,188.5 | 2,950.1 | 2,729.5 | 2,525.3 | 2,336.5 |
| Revenue Growth, % | 0 | 88.51 | 96.37 | 16.59 | -0.31258 | -7.48 | -7.48 | -7.48 | -7.48 | -7.48 |
| EBITDA | -298.4 | 370.5 | 741.7 | 1,075.4 | 1,121.4 | 484.3 | 448.1 | 414.6 | 383.6 | 354.9 |
| EBITDA, % | -37.25 | 24.54 | 25.01 | 31.11 | 32.54 | 15.19 | 15.19 | 15.19 | 15.19 | 15.19 |
| Depreciation | 259.3 | 239.9 | 267.7 | 306.1 | 330.7 | 483.0 | 446.9 | 413.5 | 382.6 | 354.0 |
| Depreciation, % | 32.38 | 15.89 | 9.03 | 8.85 | 9.6 | 15.15 | 15.15 | 15.15 | 15.15 | 15.15 |
| EBIT | -557.7 | 130.6 | 474.0 | 769.3 | 790.7 | 1.3 | 1.2 | 1.1 | 1.0 | .9 |
| EBIT, % | -69.63 | 8.65 | 15.99 | 22.25 | 22.94 | 0.04031723 | 0.04031723 | 0.04031723 | 0.04031723 | 0.04031723 |
| Total Cash | 889.9 | 1,017.4 | 934.7 | 915.2 | 1,199.2 | 1,659.2 | 1,535.1 | 1,420.3 | 1,314.1 | 1,215.8 |
| Total Cash, percent | .0 | .0 | .0 | .0 | .0 | .0 | .0 | .0 | .0 | .0 |
| Account Receivables | 71.1 | 97.2 | 148.1 | 177.3 | 187.7 | 197.0 | 182.2 | 168.6 | 156.0 | 144.3 |
| Account Receivables, % | 8.88 | 6.44 | 5 | 5.13 | 5.45 | 6.18 | 6.18 | 6.18 | 6.18 | 6.18 |
| Inventories | 74.3 | 74.8 | 93.3 | 116.6 | 132.3 | 156.8 | 145.1 | 134.2 | 124.2 | 114.9 |
| Inventories, % | 9.28 | 4.95 | 3.15 | 3.37 | 3.84 | 4.92 | 4.92 | 4.92 | 4.92 | 4.92 |
| Accounts Payable | 63.5 | 120.3 | 166.7 | 182.3 | 229.1 | 213.2 | 197.3 | 182.5 | 168.9 | 156.2 |
| Accounts Payable, % | 7.92 | 7.97 | 5.62 | 5.27 | 6.65 | 6.69 | 6.69 | 6.69 | 6.69 | 6.69 |
| Capital Expenditure | -60.5 | -495.3 | -650.7 | -829.9 | -656.3 | -671.8 | -621.6 | -575.1 | -532.1 | -492.3 |
| Capital Expenditure, % | -7.55 | -32.8 | -21.95 | -24.01 | -19.05 | -21.07 | -21.07 | -21.07 | -21.07 | -21.07 |
| Tax Rate, % | 13.83 | 13.83 | 13.83 | 13.83 | 13.83 | 13.83 | 13.83 | 13.83 | 13.83 | 13.83 |
| EBITAT | -536.8 | 105.4 | 424.9 | 647.2 | 681.3 | 1.1 | 1.0 | 1.0 | .9 | .8 |
| Depreciation | ||||||||||
| Changes in Account Receivables | ||||||||||
| Changes in Inventories | ||||||||||
| Changes in Accounts Payable | ||||||||||
| Capital Expenditure | ||||||||||
| UFCF | -419.9 | -119.8 | 18.9 | 86.7 | 376.3 | -237.3 | -163.1 | -150.9 | -139.6 | -129.2 |
| WACC, % | 6.84 | 6.66 | 6.76 | 6.7 | 6.72 | 6.74 | 6.74 | 6.74 | 6.74 | 6.74 |
| PV UFCF | ||||||||||
| SUM PV UFCF | -690.5 | |||||||||
| Long Term Growth Rate, % | 2.00 | |||||||||
| Free cash flow (T + 1) | -132 | |||||||||
| Terminal Value | -2,782 | |||||||||
| Present Terminal Value | -2,008 | |||||||||
| Enterprise Value | -2,699 | |||||||||
| Net Debt | 1,387 | |||||||||
| Equity Value | -4,086 | |||||||||
| Diluted Shares Outstanding, MM | 42 | |||||||||
| Equity Value Per Share | -97.76 |
What You Will Get
- Real CPA Financials: Access to both historical and projected data for precise valuation.
- Customizable Inputs: Adjust WACC, tax rates, revenue growth, and capital expenditures as needed.
- Dynamic Calculations: Intrinsic value and NPV are automatically computed for you.
- Scenario Analysis: Explore various scenarios to assess Copa Holdings' future performance.
- User-Friendly Design: Designed for professionals while remaining approachable for newcomers.
Key Features
- Pre-Loaded Data: Copa Holdings’ historical financial statements and pre-filled forecasts.
- Fully Adjustable Inputs: Edit WACC, tax rates, revenue growth, and EBITDA margins.
- Instant Results: See Copa Holdings’ intrinsic value recalculate in real time.
- Clear Visual Outputs: Dashboard charts display valuation results and key metrics.
- Built for Accuracy: A professional tool for analysts, investors, and finance experts.
How It Works
- Step 1: Download the Excel file.
- Step 2: Review pre-entered Copa Holdings data (historical and projected).
- Step 3: Adjust key assumptions (yellow cells) based on your analysis.
- Step 4: View automatic recalculations for Copa Holdings’ intrinsic value.
- Step 5: Use the outputs for investment decisions or reporting.
Why Choose This Calculator for Copa Holdings, S.A. (CPA)?
- User-Friendly Interface: Perfect for both novice users and seasoned professionals.
- Customizable Inputs: Adjust parameters easily to suit your financial analysis.
- Real-Time Valuation: Observe immediate updates to Copa Holdings' valuation as you tweak the inputs.
- Preloaded Data: Comes with Copa Holdings' actual financial metrics for swift assessments.
- Preferred by Experts: Favored by analysts and investors for making well-informed choices.
Who Should Use This Product?
- Professional Investors: Develop comprehensive and accurate valuation models for portfolio assessment of Copa Holdings, S.A. (CPA).
- Corporate Finance Teams: Evaluate valuation scenarios to inform corporate strategy for Copa Holdings, S.A. (CPA).
- Consultants and Advisors: Deliver precise valuation insights to clients regarding Copa Holdings, S.A. (CPA).
- Students and Educators: Utilize real-world data to enhance learning and practice in financial modeling with Copa Holdings, S.A. (CPA).
- Aviation Enthusiasts: Gain insights into how airline companies like Copa Holdings, S.A. (CPA) are valued in the financial markets.
What the Template Contains
- Pre-Filled Data: Includes Copa Holdings, S.A.'s (CPA) historical financials and forecasts.
- Discounted Cash Flow Model: Editable DCF valuation model with automatic calculations.
- Weighted Average Cost of Capital (WACC): A dedicated sheet for calculating WACC based on custom inputs.
- Key Financial Ratios: Analyze Copa Holdings, S.A.'s (CPA) profitability, efficiency, and leverage.
- Customizable Inputs: Edit revenue growth, margins, and tax rates with ease.
- Clear Dashboard: Charts and tables summarizing key valuation results.
Disclaimer
All information, articles, and product details provided on this website are for general informational and educational purposes only. We do not claim any ownership over, nor do we intend to infringe upon, any trademarks, copyrights, logos, brand names, or other intellectual property mentioned or depicted on this site. Such intellectual property remains the property of its respective owners, and any references here are made solely for identification or informational purposes, without implying any affiliation, endorsement, or partnership.
We make no representations or warranties, express or implied, regarding the accuracy, completeness, or suitability of any content or products presented. Nothing on this website should be construed as legal, tax, investment, financial, medical, or other professional advice. In addition, no part of this site—including articles or product references—constitutes a solicitation, recommendation, endorsement, advertisement, or offer to buy or sell any securities, franchises, or other financial instruments, particularly in jurisdictions where such activity would be unlawful.
All content is of a general nature and may not address the specific circumstances of any individual or entity. It is not a substitute for professional advice or services. Any actions you take based on the information provided here are strictly at your own risk. You accept full responsibility for any decisions or outcomes arising from your use of this website and agree to release us from any liability in connection with your use of, or reliance upon, the content or products found herein.