
|
CreditAccess Grameen Limited (Creditacc.NS) تقييم DCF |
Fully Editable: Tailor To Your Needs In Excel Or Sheets
Professional Design: Trusted, Industry-Standard Templates
Investor-Approved Valuation Models
MAC/PC Compatible, Fully Unlocked
No Expertise Is Needed; Easy To Follow
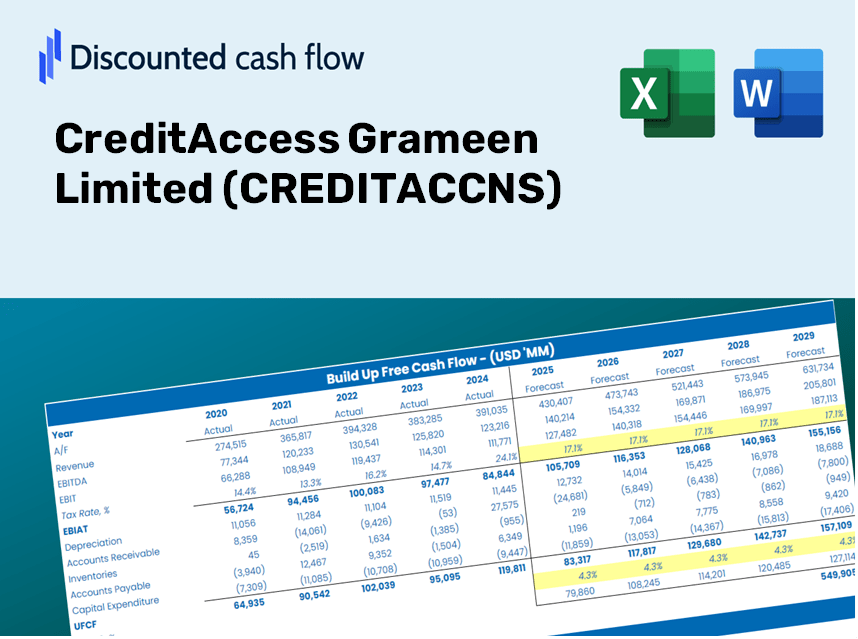
CreditAccess Grameen Limited (CREDITACC.NS) Bundle
تبحث لتحديد القيمة الجوهرية لـ CreditAccess Grameen Limited؟ تدمج حاسبة CreditActCNS DCF بيانات العالم الحقيقي مع خيارات تخصيص شاملة ، مما يتيح لك تحسين تنبؤاتك وتعزيز استراتيجيات الاستثمار الخاصة بك.
Discounted Cash Flow (DCF) - (USD MM)
| Year | AY1 2021 |
AY2 2022 |
AY3 2023 |
AY4 2024 |
AY5 2025 |
FY1 2026 |
FY2 2027 |
FY3 2028 |
FY4 2029 |
FY5 2030 |
|---|---|---|---|---|---|---|---|---|---|---|
| Revenue | 24,503.5 | 26,759.8 | 34,927.0 | 51,249.6 | 57,269.6 | 71,330.5 | 88,843.6 | 110,656.6 | 137,825.1 | 171,664.1 |
| Revenue Growth, % | 0 | 9.21 | 30.52 | 46.73 | 11.75 | 24.55 | 24.55 | 24.55 | 24.55 | 24.55 |
| EBITDA | 11,656.0 | 15,251.5 | 23,797.8 | 22,081.8 | 27,497.6 | 37,633.9 | 46,873.8 | 58,382.3 | 72,716.4 | 90,569.8 |
| EBITDA, % | 47.57 | 56.99 | 68.14 | 43.09 | 48.01 | 52.76 | 52.76 | 52.76 | 52.76 | 52.76 |
| Depreciation | 440.7 | 472.3 | 498.4 | 511.5 | 622.2 | 1,009.3 | 1,257.1 | 1,565.8 | 1,950.2 | 2,429.0 |
| Depreciation, % | 1.8 | 1.76 | 1.43 | 0.99806 | 1.09 | 1.41 | 1.41 | 1.41 | 1.41 | 1.41 |
| EBIT | 11,215.3 | 14,779.2 | 23,299.4 | 21,570.3 | 26,875.4 | 36,624.6 | 45,616.7 | 56,816.6 | 70,766.2 | 88,140.8 |
| EBIT, % | 45.77 | 55.23 | 66.71 | 42.09 | 46.93 | 51.34 | 51.34 | 51.34 | 51.34 | 51.34 |
| Total Cash | 24,667.2 | 16,797.6 | 20,405.3 | 26,423.0 | 22,922.8 | 44,621.2 | 55,576.7 | 69,221.9 | 86,217.3 | 107,385.5 |
| Total Cash, percent | .0 | .0 | .0 | .0 | .0 | .0 | .0 | .0 | .0 | .0 |
| Account Receivables | 1,136.4 | 941.0 | 1,188.9 | 785.5 | 234.0 | 1,925.8 | 2,398.7 | 2,987.6 | 3,721.1 | 4,634.7 |
| Account Receivables, % | 4.64 | 3.52 | 3.4 | 1.53 | 0.40859 | 2.7 | 2.7 | 2.7 | 2.7 | 2.7 |
| Inventories | 73,992.1 | 89,141.7 | 189,374.5 | .0 | .0 | 42,798.3 | 53,306.2 | 66,394.0 | 82,695.1 | 102,998.4 |
| Inventories, % | 301.97 | 333.12 | 542.2 | 0 | 0 | 60 | 60 | 60 | 60 | 60 |
| Accounts Payable | 220.5 | 347.8 | 440.5 | 365.2 | 320.6 | 675.2 | 841.0 | 1,047.5 | 1,304.7 | 1,625.0 |
| Accounts Payable, % | 0.89987 | 1.3 | 1.26 | 0.71259 | 0.55981 | 0.94664 | 0.94664 | 0.94664 | 0.94664 | 0.94664 |
| Capital Expenditure | -145.6 | -278.6 | -173.2 | -118.5 | -266.8 | -403.5 | -502.6 | -625.9 | -779.6 | -971.0 |
| Capital Expenditure, % | -0.5942 | -1.04 | -0.49589 | -0.23122 | -0.46587 | -0.56566 | -0.56566 | -0.56566 | -0.56566 | -0.56566 |
| Tax Rate, % | 25.04 | 25.04 | 25.04 | 25.04 | 25.04 | 25.04 | 25.04 | 25.04 | 25.04 | 25.04 |
| EBITAT | 8,331.9 | 10,853.2 | 17,411.2 | 16,083.7 | 20,147.0 | 27,247.4 | 33,937.2 | 42,269.5 | 52,647.6 | 65,573.7 |
| Depreciation | ||||||||||
| Changes in Account Receivables | ||||||||||
| Changes in Inventories | ||||||||||
| Changes in Accounts Payable | ||||||||||
| Capital Expenditure | ||||||||||
| UFCF | -66,281.0 | -3,780.0 | -82,651.6 | 206,179.3 | 21,009.3 | -16,282.2 | 23,876.9 | 29,739.1 | 37,040.7 | 46,135.0 |
| WACC, % | 3.6 | 3.59 | 3.61 | 3.61 | 3.61 | 3.6 | 3.6 | 3.6 | 3.6 | 3.6 |
| PV UFCF | ||||||||||
| SUM PV UFCF | 104,072.1 | |||||||||
| Long Term Growth Rate, % | 2.00 | |||||||||
| Free cash flow (T + 1) | 47,058 | |||||||||
| Terminal Value | 2,934,519 | |||||||||
| Present Terminal Value | 2,458,459 | |||||||||
| Enterprise Value | 2,562,531 | |||||||||
| Net Debt | 191,743 | |||||||||
| Equity Value | 2,370,788 | |||||||||
| Diluted Shares Outstanding, MM | 160 | |||||||||
| Equity Value Per Share | 14,829.66 |
ماذا ستتلقى
- البيانات المالية الائتمانية الأصلية: يتضمن البيانات التاريخية والمتوقعة لـ CreditAccess Grameen Limited لإجراء تحليل دقيق.
- قالب قابل للتخصيص: بسهولة ضبط المعلمات الرئيسية مثل نمو الإيرادات و WACC و EBITDA ٪ لتناسب احتياجاتك.
- الحسابات الفورية: شاهد كقيمة جوهرية لتحديثات الائتمان في الوقت الفعلي مع تعديلاتك.
- أداة تقييم شاملة: مصمم للمستثمرين والمحللين والمستشارين الذين يحتاجون إلى نتائج موثوقة DCF.
- تصميم بديهي: التصميم المباشر والإرشادات الواضحة مناسبة للمستخدمين من جميع مستويات الخبرة.
الميزات الرئيسية
- مدخلات مالية قابلة للتخصيص: اضبط المقاييس الأساسية مثل نمو القروض وأسعار الفائدة ونفقات التشغيل.
- حسابات التقييم الفوري: يوفر رؤى فورية في القيمة الجوهرية ، NPV ، والمقاييس المالية الإضافية.
- تحليل عالي الدقة: يستخدم البيانات المالية الفعلية لـ CreditAccess Grameen Limited لنتائج التقييم الدقيقة.
- نمذجة السيناريو المبسط: تقييم دون عناء الافتراضات وتحليل الآثار الناتجة.
- محسن الكفاءة: قم بإزالة تعقيد إنشاء نماذج تقييم معقدة من الألف إلى الياء.
كيف تعمل
- الخطوة 1: قم بتنزيل ملف Excel.
- الخطوة 2: فحص بيانات وتوقعات CreditAccess Grameen Limited (CreditActcns) المملوءة مسبقًا.
- الخطوة 3: اضبط المدخلات الرئيسية مثل نمو الإيرادات ، و WACC ، ومعدلات الضرائب (الخلايا المميزة لراحتك).
- الخطوة 4: راقب تحديث نموذج DCF في الوقت الفعلي أثناء تعديل افتراضاتك.
- الخطوة 5: مراجعة المخرجات والاستفادة من النتائج لقرارات الاستثمار المستنيرة.
لماذا تختار هذه الآلة الحاسبة؟
- بيانات موثوقة: تضمن البيانات المالية الأصلية من CreditAccess Grameen Limited (CreditAccns) نتائج التقييم الجديرة بالثقة.
- خيارات مرنة: تخصيص المعلمات الأساسية مثل معدلات النمو و WACC ومعدلات الضرائب لتتماشى مع توقعاتك.
- كفاءة: توفر لك الحسابات المسببة للتشكيل مسبقًا متاعب البدء من الصفر.
- الأداة المهنية: صُنعت للمستثمرين والمحللين والمستشارين في قطاع التمويل.
- سهل الاستخدام: التصميم البديهي والإرشادات الواضحة خطوة بخطوة تجعلها في متناول الجميع.
من يجب أن يستخدم هذا المنتج؟
- المستثمرون الأفراد: كسب رؤى لاتخاذ قرارات متعلمة بشأن شراء أو بيع أسهم CreditAccess Grameen Limited (CreditAct).
- المحللون الماليون: عزز منهجيات التقييم الخاصة بك مع نماذج مالية شاملة مصممة خصيصًا للائتمان.
- الاستشاريون: تزويد العملاء بتحليل تقييم دقيق وفي الوقت المناسب المتعلق بـ CreditActs.
- أصحاب الأعمال: تعلم من أساليب تقييم الشركات المعروفة مثل CreditAccess Grameen Limited (CreditActs) لإبلاغ استراتيجيات عملك الخاصة.
- طلاب التمويل: استكشف تقنيات التقييم في العالم الحقيقي من خلال عدسة البيانات المالية للبيانات والسيناريوهات.
محتويات القالب
- البيانات التاريخية: تضم الأداء المالي السابق لـ CreditAccess Grameen Limited والتوقعات التأسيسية.
- نماذج DCF و Ruvered DCF: قوالب شاملة لتحديد القيمة الجوهرية لـ CreditAccess Grameen Limited.
- ورقة WACC: مقاييس محسوبة مسبقًا لمتوسط تكلفة رأس المال المرجح.
- مدخلات قابلة للتحرير: تخصيص برامج التشغيل الأساسية مثل معدلات النمو ونسب EBITDA وتوقعات CAPEX.
- البيانات الفصلية والسنوية: تحليل شامل للتقارير المالية لـ CreditAccess Grameen Limited.
- لوحة القيادة التفاعلية: تصور ديناميكيا نتائج التقييم والتوقعات.
Disclaimer
All information, articles, and product details provided on this website are for general informational and educational purposes only. We do not claim any ownership over, nor do we intend to infringe upon, any trademarks, copyrights, logos, brand names, or other intellectual property mentioned or depicted on this site. Such intellectual property remains the property of its respective owners, and any references here are made solely for identification or informational purposes, without implying any affiliation, endorsement, or partnership.
We make no representations or warranties, express or implied, regarding the accuracy, completeness, or suitability of any content or products presented. Nothing on this website should be construed as legal, tax, investment, financial, medical, or other professional advice. In addition, no part of this site—including articles or product references—constitutes a solicitation, recommendation, endorsement, advertisement, or offer to buy or sell any securities, franchises, or other financial instruments, particularly in jurisdictions where such activity would be unlawful.
All content is of a general nature and may not address the specific circumstances of any individual or entity. It is not a substitute for professional advice or services. Any actions you take based on the information provided here are strictly at your own risk. You accept full responsibility for any decisions or outcomes arising from your use of this website and agree to release us from any liability in connection with your use of, or reliance upon, the content or products found herein.