
|
Cirrus Logic ، Inc. (CRUS) DCF تقييم |
Fully Editable: Tailor To Your Needs In Excel Or Sheets
Professional Design: Trusted, Industry-Standard Templates
Investor-Approved Valuation Models
MAC/PC Compatible, Fully Unlocked
No Expertise Is Needed; Easy To Follow
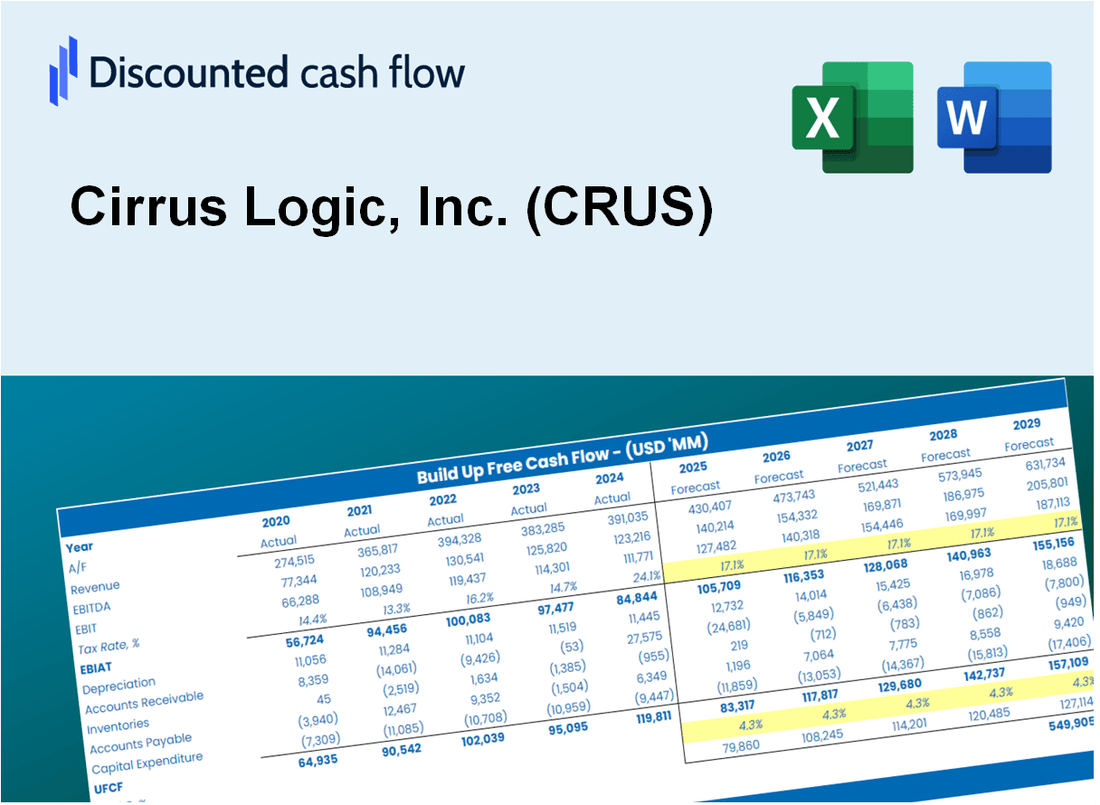
Cirrus Logic, Inc. (CRUS) Bundle
عزز استراتيجيات الاستثمار الخاصة بك مع حاسبة Cirrus Logic ، Inc. (CRUS) DCF! استكشاف البيانات المالية الأصلية لمنطق Cirrus ، وضبط تنبؤات النمو والنفقات ، ومراقبة على الفور كيف تؤثر هذه التغييرات على القيمة الجوهرية لـ Cirrus Logic ، Inc. (CRUS).
Discounted Cash Flow (DCF) - (USD MM)
| Year | AY1 2021 |
AY2 2022 |
AY3 2023 |
AY4 2024 |
AY5 2025 |
FY1 2026 |
FY2 2027 |
FY3 2028 |
FY4 2029 |
FY5 2030 |
|---|---|---|---|---|---|---|---|---|---|---|
| Revenue | 1,369.2 | 1,781.5 | 1,897.6 | 1,788.9 | 1,896.1 | 2,070.9 | 2,261.9 | 2,470.5 | 2,698.4 | 2,947.2 |
| Revenue Growth, % | 0 | 30.11 | 6.52 | -5.73 | 5.99 | 9.22 | 9.22 | 9.22 | 9.22 | 9.22 |
| EBITDA | 285.7 | 431.7 | 316.4 | 413.1 | 496.8 | 460.0 | 502.5 | 548.8 | 599.4 | 654.7 |
| EBITDA, % | 20.87 | 24.23 | 16.68 | 23.09 | 26.2 | 22.21 | 22.21 | 22.21 | 22.21 | 22.21 |
| Depreciation | 39.4 | 62.1 | 60.8 | 48.3 | 51.0 | 61.9 | 67.6 | 73.9 | 80.7 | 88.1 |
| Depreciation, % | 2.88 | 3.48 | 3.2 | 2.7 | 2.69 | 2.99 | 2.99 | 2.99 | 2.99 | 2.99 |
| EBIT | 246.3 | 369.6 | 255.6 | 364.9 | 445.8 | 398.1 | 434.8 | 474.9 | 518.7 | 566.5 |
| EBIT, % | 17.99 | 20.75 | 13.47 | 20.4 | 23.51 | 19.22 | 19.22 | 19.22 | 19.22 | 19.22 |
| Total Cash | 497.9 | 380.4 | 480.8 | 526.5 | 595.8 | 596.0 | 651.0 | 711.0 | 776.6 | 848.2 |
| Total Cash, percent | .0 | .0 | .0 | .0 | .0 | .0 | .0 | .0 | .0 | .0 |
| Account Receivables | 108.7 | 240.3 | 150.5 | 162.5 | 216.0 | 206.4 | 225.4 | 246.2 | 268.9 | 293.7 |
| Account Receivables, % | 7.94 | 13.49 | 7.93 | 9.08 | 11.39 | 9.97 | 9.97 | 9.97 | 9.97 | 9.97 |
| Inventories | 173.3 | 138.4 | 233.5 | 227.2 | 299.1 | 253.5 | 276.9 | 302.4 | 330.3 | 360.8 |
| Inventories, % | 12.65 | 7.77 | 12.3 | 12.7 | 15.77 | 12.24 | 12.24 | 12.24 | 12.24 | 12.24 |
| Accounts Payable | 102.7 | 115.4 | 81.5 | 55.5 | 63.2 | 102.4 | 111.8 | 122.1 | 133.4 | 145.7 |
| Accounts Payable, % | 7.5 | 6.48 | 4.29 | 3.1 | 3.33 | 4.94 | 4.94 | 4.94 | 4.94 | 4.94 |
| Capital Expenditure | -18.3 | -30.0 | -36.7 | -37.7 | -28.8 | -35.5 | -38.8 | -42.4 | -46.3 | -50.5 |
| Capital Expenditure, % | -1.33 | -1.68 | -1.93 | -2.1 | -1.52 | -1.71 | -1.71 | -1.71 | -1.71 | -1.71 |
| Tax Rate, % | 25.49 | 25.49 | 25.49 | 25.49 | 25.49 | 25.49 | 25.49 | 25.49 | 25.49 | 25.49 |
| EBITAT | 218.3 | 327.2 | 177.3 | 275.3 | 332.2 | 315.7 | 344.8 | 376.6 | 411.3 | 449.2 |
| Depreciation | ||||||||||
| Changes in Account Receivables | ||||||||||
| Changes in Inventories | ||||||||||
| Changes in Accounts Payable | ||||||||||
| Capital Expenditure | ||||||||||
| UFCF | 60.2 | 275.2 | 162.2 | 254.2 | 236.6 | 436.5 | 340.7 | 372.1 | 406.4 | 443.9 |
| WACC, % | 8.67 | 8.67 | 8.66 | 8.66 | 8.66 | 8.67 | 8.67 | 8.67 | 8.67 | 8.67 |
| PV UFCF | ||||||||||
| SUM PV UFCF | 1,564.5 | |||||||||
| Long Term Growth Rate, % | 3.00 | |||||||||
| Free cash flow (T + 1) | 457 | |||||||||
| Terminal Value | 8,069 | |||||||||
| Present Terminal Value | 5,325 | |||||||||
| Enterprise Value | 6,890 | |||||||||
| Net Debt | -396 | |||||||||
| Equity Value | 7,286 | |||||||||
| Diluted Shares Outstanding, MM | 55 | |||||||||
| Equity Value Per Share | 131.89 |
What You Will Get
- Real CRUS Financial Data: Pre-filled with Cirrus Logic’s historical and projected data for precise analysis.
- Fully Editable Template: Modify key inputs like revenue growth, WACC, and EBITDA % with ease.
- Automatic Calculations: See Cirrus Logic’s intrinsic value update instantly based on your changes.
- Professional Valuation Tool: Designed for investors, analysts, and consultants seeking accurate DCF results.
- User-Friendly Design: Simple structure and clear instructions for all experience levels.
Key Features
- Comprehensive Historical Data: Cirrus Logic's historical financial statements and pre-filled projections.
- Customizable Assumptions: Modify WACC, tax rates, revenue growth, and EBITDA margins as needed.
- Real-Time Calculations: Witness Cirrus Logic’s intrinsic value update instantly.
- Intuitive Visualizations: Dashboard graphs present valuation results and essential metrics clearly.
- Designed for Precision: A specialized tool for analysts, investors, and finance professionals.
How It Works
- Step 1: Download the prebuilt Excel template featuring Cirrus Logic, Inc. (CRUS) data.
- Step 2: Navigate through the pre-filled sheets to familiarize yourself with the key performance indicators.
- Step 3: Modify forecasts and assumptions in the editable yellow cells (WACC, growth, margins).
- Step 4: Immediately see the updated results, including Cirrus Logic, Inc. (CRUS)'s intrinsic value.
- Step 5: Use the outputs to make informed investment choices or create comprehensive reports.
Why Choose This Calculator for Cirrus Logic, Inc. (CRUS)?
- User-Friendly Interface: Tailored for both novices and seasoned professionals.
- Customizable Inputs: Adjust parameters to suit your financial analysis needs.
- Real-Time Valuation: Observe immediate updates to Cirrus Logic's valuation as you change inputs.
- Pre-Loaded Data: Comes equipped with Cirrus Logic’s latest financial information for swift evaluations.
- Widely Endorsed: Favored by investors and analysts for making strategic decisions.
Who Should Use This Product?
- Finance Students: Explore valuation methods and apply them using real-time data for Cirrus Logic, Inc. (CRUS).
- Academics: Integrate advanced financial models into your teaching or research on Cirrus Logic, Inc. (CRUS).
- Investors: Validate your investment strategies and evaluate valuation scenarios for Cirrus Logic, Inc. (CRUS).
- Analysts: Enhance your analysis with a customizable DCF model tailored for Cirrus Logic, Inc. (CRUS).
- Small Business Owners: Understand the analytical approaches used for assessing companies like Cirrus Logic, Inc. (CRUS).
What the Template Contains
- Pre-Filled DCF Model: Cirrus Logic, Inc.'s (CRUS) financial data preloaded for immediate use.
- WACC Calculator: Detailed calculations for Weighted Average Cost of Capital.
- Financial Ratios: Evaluate Cirrus Logic, Inc.'s (CRUS) profitability, leverage, and efficiency.
- Editable Inputs: Change assumptions such as growth, margins, and CAPEX to fit your scenarios.
- Financial Statements: Annual and quarterly reports to support detailed analysis.
- Interactive Dashboard: Easily visualize key valuation metrics and results.
Disclaimer
All information, articles, and product details provided on this website are for general informational and educational purposes only. We do not claim any ownership over, nor do we intend to infringe upon, any trademarks, copyrights, logos, brand names, or other intellectual property mentioned or depicted on this site. Such intellectual property remains the property of its respective owners, and any references here are made solely for identification or informational purposes, without implying any affiliation, endorsement, or partnership.
We make no representations or warranties, express or implied, regarding the accuracy, completeness, or suitability of any content or products presented. Nothing on this website should be construed as legal, tax, investment, financial, medical, or other professional advice. In addition, no part of this site—including articles or product references—constitutes a solicitation, recommendation, endorsement, advertisement, or offer to buy or sell any securities, franchises, or other financial instruments, particularly in jurisdictions where such activity would be unlawful.
All content is of a general nature and may not address the specific circumstances of any individual or entity. It is not a substitute for professional advice or services. Any actions you take based on the information provided here are strictly at your own risk. You accept full responsibility for any decisions or outcomes arising from your use of this website and agree to release us from any liability in connection with your use of, or reliance upon, the content or products found herein.