
|
Corvel Corporation (CRVL) DCF تقييم |
Fully Editable: Tailor To Your Needs In Excel Or Sheets
Professional Design: Trusted, Industry-Standard Templates
Investor-Approved Valuation Models
MAC/PC Compatible, Fully Unlocked
No Expertise Is Needed; Easy To Follow
CorVel Corporation (CRVL) Bundle
وفر الوقت وتحسين الدقة مع حاسبة (CRVL) DCF! مدعومًا بالبيانات الفعلية من Corvel Corporation والافتراضات القابلة للتخصيص ، تمكنك هذه الأداة من التنبؤ وتحليل وقيمة Corvel مثل المستثمر المخضرم.
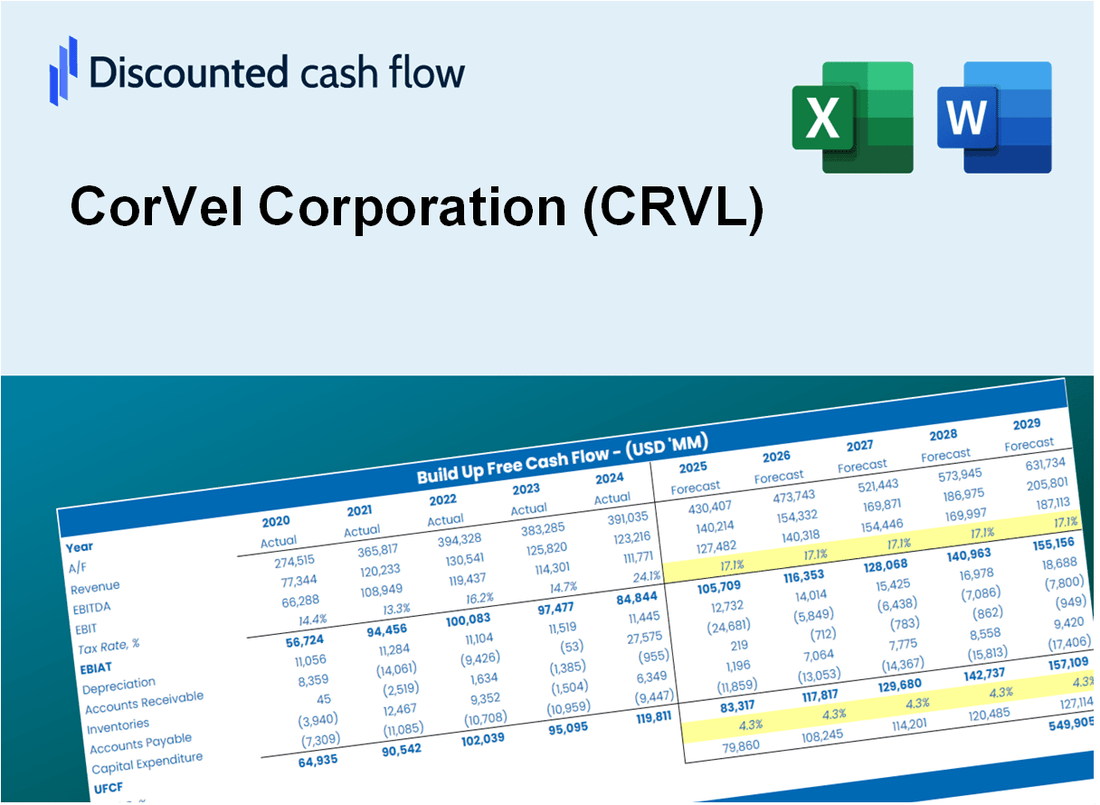
Discounted Cash Flow (DCF) - (USD MM)
| Year | AY1 2021 |
AY2 2022 |
AY3 2023 |
AY4 2024 |
AY5 2025 |
FY1 2026 |
FY2 2027 |
FY3 2028 |
FY4 2029 |
FY5 2030 |
|---|---|---|---|---|---|---|---|---|---|---|
| Revenue | 552.6 | 646.2 | 718.6 | 795.3 | 895.6 | 1,010.7 | 1,140.6 | 1,287.2 | 1,452.7 | 1,639.4 |
| Revenue Growth, % | 0 | 16.93 | 11.19 | 10.68 | 12.61 | 12.85 | 12.85 | 12.85 | 12.85 | 12.85 |
| EBITDA | 82.6 | 108.4 | 109.7 | 121.4 | 150.4 | 159.8 | 180.3 | 203.5 | 229.6 | 259.2 |
| EBITDA, % | 14.95 | 16.78 | 15.26 | 15.26 | 16.79 | 15.81 | 15.81 | 15.81 | 15.81 | 15.81 |
| Depreciation | 23.4 | 23.9 | 25.1 | 26.3 | 29.5 | 36.5 | 41.1 | 46.4 | 52.4 | 59.1 |
| Depreciation, % | 4.24 | 3.7 | 3.5 | 3.3 | 3.3 | 3.61 | 3.61 | 3.61 | 3.61 | 3.61 |
| EBIT | 59.2 | 84.5 | 84.6 | 95.1 | 120.8 | 123.3 | 139.2 | 157.0 | 177.2 | 200.0 |
| EBIT, % | 10.71 | 13.08 | 11.77 | 11.96 | 13.49 | 12.2 | 12.2 | 12.2 | 12.2 | 12.2 |
| Total Cash | 139.7 | 97.5 | 71.3 | 105.6 | 170.6 | 167.0 | 188.5 | 212.7 | 240.0 | 270.9 |
| Total Cash, percent | .0 | .0 | .0 | .0 | .0 | .0 | .0 | .0 | .0 | .0 |
| Account Receivables | 64.7 | 82.6 | 81.0 | 97.1 | 104.1 | 120.5 | 136.0 | 153.5 | 173.2 | 195.4 |
| Account Receivables, % | 11.71 | 12.78 | 11.28 | 12.21 | 11.63 | 11.92 | 11.92 | 11.92 | 11.92 | 11.92 |
| Inventories | .0 | .0 | .0 | .0 | .0 | .0 | .0 | .0 | .0 | .0 |
| Inventories, % | 0 | 0 | 0 | 0 | 0 | 0 | 0 | 0 | 0 | 0 |
| Accounts Payable | 12.4 | 14.1 | 15.1 | 16.4 | 15.4 | 20.8 | 23.5 | 26.5 | 29.9 | 33.8 |
| Accounts Payable, % | 2.24 | 2.18 | 2.1 | 2.06 | 1.72 | 2.06 | 2.06 | 2.06 | 2.06 | 2.06 |
| Capital Expenditure | -17.2 | -29.8 | -26.3 | -29.2 | -35.8 | -38.5 | -43.5 | -49.1 | -55.4 | -62.5 |
| Capital Expenditure, % | -3.12 | -4.61 | -3.66 | -3.68 | -3.99 | -3.81 | -3.81 | -3.81 | -3.81 | -3.81 |
| Tax Rate, % | 21.24 | 21.24 | 21.24 | 21.24 | 21.24 | 21.24 | 21.24 | 21.24 | 21.24 | 21.24 |
| EBITAT | 46.4 | 66.4 | 66.4 | 76.3 | 95.2 | 97.3 | 109.8 | 123.9 | 139.8 | 157.8 |
| Depreciation | ||||||||||
| Changes in Account Receivables | ||||||||||
| Changes in Inventories | ||||||||||
| Changes in Accounts Payable | ||||||||||
| Capital Expenditure | ||||||||||
| UFCF | .2 | 44.4 | 67.7 | 58.5 | 80.9 | 84.2 | 94.6 | 106.8 | 120.5 | 136.0 |
| WACC, % | 8.85 | 8.85 | 8.85 | 8.85 | 8.85 | 8.85 | 8.85 | 8.85 | 8.85 | 8.85 |
| PV UFCF | ||||||||||
| SUM PV UFCF | 414.8 | |||||||||
| Long Term Growth Rate, % | 0.50 | |||||||||
| Free cash flow (T + 1) | 137 | |||||||||
| Terminal Value | 1,637 | |||||||||
| Present Terminal Value | 1,072 | |||||||||
| Enterprise Value | 1,486 | |||||||||
| Net Debt | -143 | |||||||||
| Equity Value | 1,629 | |||||||||
| Diluted Shares Outstanding, MM | 52 | |||||||||
| Equity Value Per Share | 31.30 |
What You Will Get
- Real CRVL Financials: Access to historical and projected data for precise valuation.
- Customizable Inputs: Adjust WACC, tax rates, revenue growth, and capital expenditures as needed.
- Dynamic Calculations: Intrinsic value and NPV are computed in real-time.
- Scenario Analysis: Explore various scenarios to assess CorVel’s future performance.
- User-Friendly Design: Designed for professionals while remaining approachable for newcomers.
Key Features
- Comprehensive Financial Data: CorVel Corporation’s (CRVL) historical financial statements and pre-filled projections.
- Customizable Parameters: Modify WACC, tax rates, revenue growth, and EBITDA margins as needed.
- Real-Time Valuation: Observe the recalculation of CorVel’s (CRVL) intrinsic value instantly.
- Intuitive Visualizations: Dashboard charts showcase valuation results and essential metrics.
- Designed for Precision: A professional-grade tool tailored for analysts, investors, and finance professionals.
How It Works
- Step 1: Download the Excel file.
- Step 2: Review pre-entered CorVel Corporation (CRVL) data (historical and projected).
- Step 3: Adjust key assumptions (yellow cells) based on your analysis.
- Step 4: View automatic recalculations for CorVel Corporation’s intrinsic value.
- Step 5: Use the outputs for investment decisions or reporting.
Why Choose CorVel Corporation (CRVL)?
- Streamlined Processes: Our solutions eliminate the need for cumbersome manual tasks, making operations efficient.
- Enhanced Accuracy: Utilize our proven methodologies and data to minimize errors in your assessments.
- Completely Adaptable: Customize our services to align with your specific needs and objectives.
- User-Friendly Interface: Intuitive design ensures that results are straightforward to understand and implement.
- Endorsed by Industry Leaders: Our offerings are trusted by professionals who prioritize quality and effectiveness.
Who Should Use This Product?
- Investors: Assess CorVel Corporation’s (CRVL) valuation prior to making investment decisions.
- CFOs and Financial Analysts: Enhance valuation methodologies and evaluate financial forecasts.
- Startup Founders: Understand the valuation strategies of established companies like CorVel Corporation.
- Consultants: Provide accurate valuation assessments and reports for clients.
- Students and Educators: Utilize current data to learn and teach valuation practices.
What the Template Contains
- Pre-Filled Data: Includes CorVel Corporation’s historical financials and forecasts.
- Discounted Cash Flow Model: Editable DCF valuation model with automatic calculations.
- Weighted Average Cost of Capital (WACC): A dedicated sheet for calculating WACC based on custom inputs.
- Key Financial Ratios: Analyze CorVel Corporation’s profitability, efficiency, and leverage.
- Customizable Inputs: Edit revenue growth, margins, and tax rates with ease.
- Clear Dashboard: Charts and tables summarizing key valuation results.
Disclaimer
All information, articles, and product details provided on this website are for general informational and educational purposes only. We do not claim any ownership over, nor do we intend to infringe upon, any trademarks, copyrights, logos, brand names, or other intellectual property mentioned or depicted on this site. Such intellectual property remains the property of its respective owners, and any references here are made solely for identification or informational purposes, without implying any affiliation, endorsement, or partnership.
We make no representations or warranties, express or implied, regarding the accuracy, completeness, or suitability of any content or products presented. Nothing on this website should be construed as legal, tax, investment, financial, medical, or other professional advice. In addition, no part of this site—including articles or product references—constitutes a solicitation, recommendation, endorsement, advertisement, or offer to buy or sell any securities, franchises, or other financial instruments, particularly in jurisdictions where such activity would be unlawful.
All content is of a general nature and may not address the specific circumstances of any individual or entity. It is not a substitute for professional advice or services. Any actions you take based on the information provided here are strictly at your own risk. You accept full responsibility for any decisions or outcomes arising from your use of this website and agree to release us from any liability in connection with your use of, or reliance upon, the content or products found herein.