
|
CSG Systems International ، Inc. (CSGS) DCF تقييم |
Fully Editable: Tailor To Your Needs In Excel Or Sheets
Professional Design: Trusted, Industry-Standard Templates
Investor-Approved Valuation Models
MAC/PC Compatible, Fully Unlocked
No Expertise Is Needed; Easy To Follow
CSG Systems International, Inc. (CSGS) Bundle
استكشف النظرة المالية لـ CSG Systems International ، Inc. (CSGS) مع حاسبة DCF سهلة الاستخدام! أدخل توقعاتك على النمو وهامش الربح والمصروفات لتحديد القيمة الجوهرية لـ CSG Systems International ، Inc. (CSGS) وصقل نهج الاستثمار الخاص بك.
What You Will Receive
- Flexible Forecast Inputs: Effortlessly modify assumptions (growth %, margins, WACC) to explore various scenarios.
- Real-World Data: CSG Systems International, Inc.'s (CSGS) financial data pre-loaded to enhance your analysis.
- Automated DCF Outputs: The template computes Net Present Value (NPV) and intrinsic value automatically.
- Customizable and Professional: A sleek Excel model tailored to meet your valuation requirements.
- Designed for Analysts and Investors: Perfect for evaluating projections, confirming strategies, and optimizing time.
Key Features
- Advanced DCF Calculator: Features comprehensive unlevered and levered DCF valuation models tailored for CSG Systems International, Inc. (CSGS).
- WACC Calculator: Ready-to-use Weighted Average Cost of Capital sheet with adjustable inputs specific to CSGS.
- Editable Forecast Assumptions: Customize growth rates, capital expenditures, and discount rates to fit CSGS projections.
- Built-In Financial Ratios: Evaluate profitability, leverage, and efficiency ratios relevant to CSG Systems International, Inc. (CSGS).
- Dashboard and Charts: Visual representations summarize essential valuation metrics for streamlined analysis of CSGS.
How It Works
- Step 1: Download the Excel file for CSG Systems International, Inc. (CSGS).
- Step 2: Review the pre-filled financial data and forecasts specific to CSG Systems.
- Step 3: Adjust key inputs such as revenue growth, WACC, and tax rates (highlighted cells).
- Step 4: Observe the DCF model update in real-time as you modify your assumptions.
- Step 5: Evaluate the outputs and leverage the results for your investment strategies.
Why Choose CSG Systems International, Inc. (CSGS) Calculator?
- Accuracy: Utilizes real CSG Systems financial data for precise calculations.
- Flexibility: Allows users to easily test and adjust inputs according to their needs.
- Time-Saving: Eliminates the need to create complex financial models from the ground up.
- Professional-Grade: Crafted with the expertise and precision expected at the CFO level.
- User-Friendly: Intuitive design makes it accessible for users with varying levels of financial modeling skills.
Who Should Use This Product?
- Investors: Evaluate CSG Systems International, Inc.'s (CSGS) financial health before making investment decisions.
- CFOs and Financial Analysts: Enhance valuation methodologies and assess future earnings for CSGS.
- Startup Founders: Discover the valuation strategies employed by established companies like CSG Systems International.
- Consultants: Create detailed valuation analyses and reports for your clients based on CSGS data.
- Students and Educators: Utilize real-time data from CSG Systems International to teach and learn valuation principles.
What the Template Contains
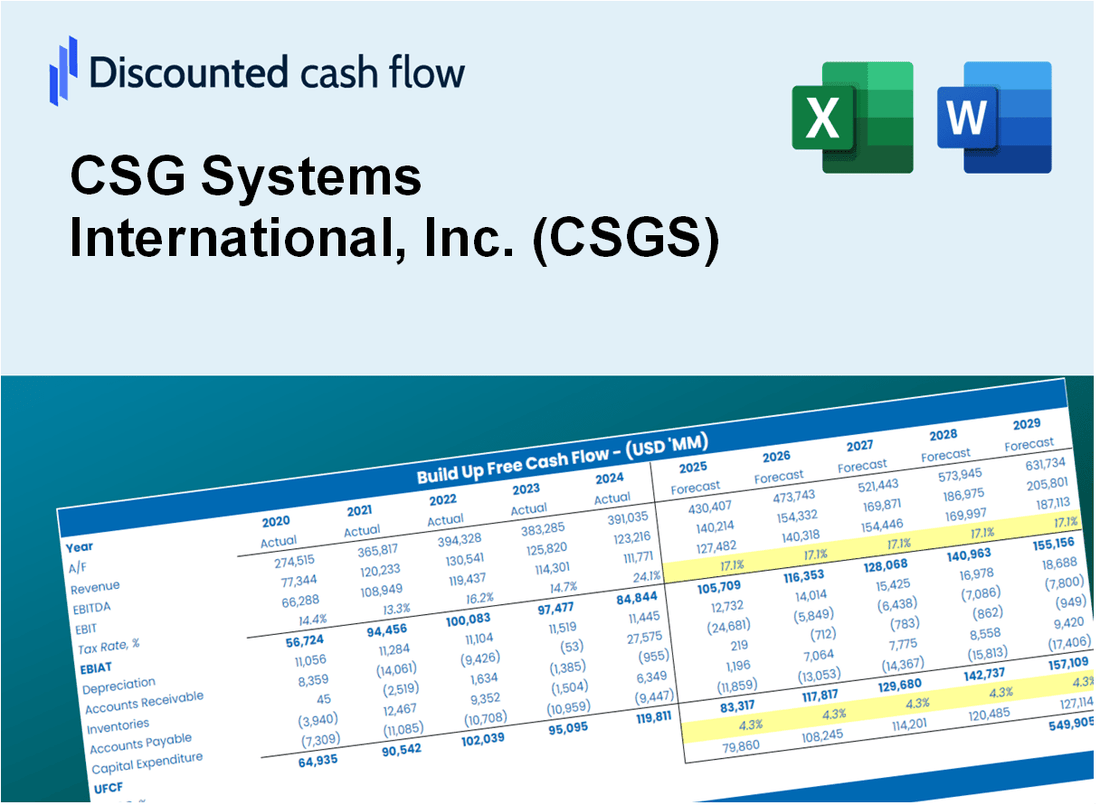
- Preloaded CSGS Data: Historical and projected financial data, including revenue, EBIT, and capital expenditures.
- DCF and WACC Models: Professional-grade sheets for calculating intrinsic value and Weighted Average Cost of Capital.
- Editable Inputs: Yellow-highlighted cells for adjusting revenue growth, tax rates, and discount rates.
- Financial Statements: Comprehensive annual and quarterly financials for deeper analysis.
- Key Ratios: Profitability, leverage, and efficiency ratios to evaluate performance.
- Dashboard and Charts: Visual summaries of valuation outcomes and assumptions.
Disclaimer
All information, articles, and product details provided on this website are for general informational and educational purposes only. We do not claim any ownership over, nor do we intend to infringe upon, any trademarks, copyrights, logos, brand names, or other intellectual property mentioned or depicted on this site. Such intellectual property remains the property of its respective owners, and any references here are made solely for identification or informational purposes, without implying any affiliation, endorsement, or partnership.
We make no representations or warranties, express or implied, regarding the accuracy, completeness, or suitability of any content or products presented. Nothing on this website should be construed as legal, tax, investment, financial, medical, or other professional advice. In addition, no part of this site—including articles or product references—constitutes a solicitation, recommendation, endorsement, advertisement, or offer to buy or sell any securities, franchises, or other financial instruments, particularly in jurisdictions where such activity would be unlawful.
All content is of a general nature and may not address the specific circumstances of any individual or entity. It is not a substitute for professional advice or services. Any actions you take based on the information provided here are strictly at your own risk. You accept full responsibility for any decisions or outcomes arising from your use of this website and agree to release us from any liability in connection with your use of, or reliance upon, the content or products found herein.