
|
Caesarstone Ltd. (CSTE) تقييم DCF |
Fully Editable: Tailor To Your Needs In Excel Or Sheets
Professional Design: Trusted, Industry-Standard Templates
Investor-Approved Valuation Models
MAC/PC Compatible, Fully Unlocked
No Expertise Is Needed; Easy To Follow
Caesarstone Ltd. (CSTE) Bundle
سواء كنت مستثمرًا أو محللًا ، فإن حاسبة DCF (CSTE) هذه هي موردك الأساسي للتقييم الدقيق. تم تحميلها مسبقًا بالبيانات من Caesarstone Ltd. ، يمكنك بسهولة ضبط التنبؤات ومراقبة التأثيرات في الوقت الفعلي.
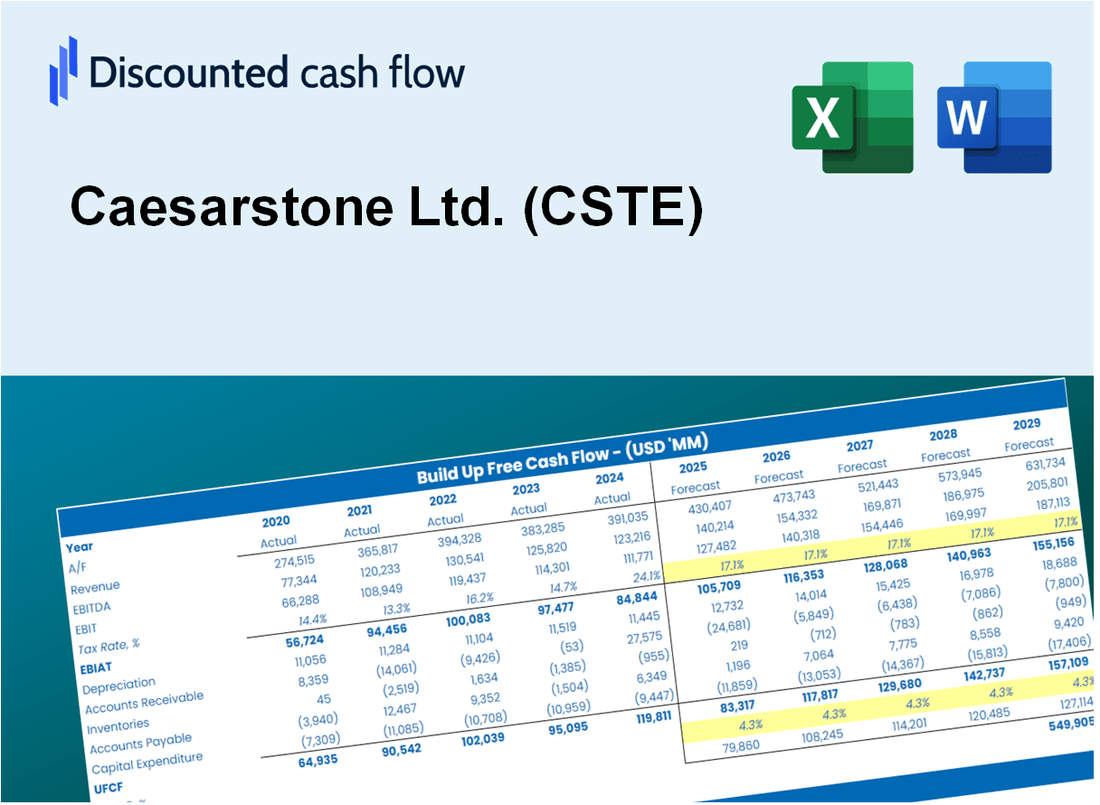
Discounted Cash Flow (DCF) - (USD MM)
| Year | AY1 2020 |
AY2 2021 |
AY3 2022 |
AY4 2023 |
AY5 2024 |
FY1 2025 |
FY2 2026 |
FY3 2027 |
FY4 2028 |
FY5 2029 |
|---|---|---|---|---|---|---|---|---|---|---|
| Revenue | 486.4 | 643.9 | 690.8 | 565.2 | 443.2 | 443.1 | 443.0 | 442.9 | 442.8 | 442.7 |
| Revenue Growth, % | 0 | 32.38 | 7.29 | -18.18 | -21.59 | -0.02551393 | -0.02551393 | -0.02551393 | -0.02551393 | -0.02551393 |
| EBITDA | 46.1 | 62.0 | -13.5 | -51.6 | -20.6 | 3.0 | 3.0 | 3.0 | 3.0 | 3.0 |
| EBITDA, % | 9.48 | 9.63 | -1.96 | -9.13 | -4.65 | 0.6717 | 0.6717 | 0.6717 | 0.6717 | 0.6717 |
| Depreciation | 29.5 | 35.4 | 36.3 | 30.0 | 17.1 | 23.0 | 23.0 | 23.0 | 23.0 | 23.0 |
| Depreciation, % | 6.06 | 5.5 | 5.26 | 5.31 | 3.87 | 5.2 | 5.2 | 5.2 | 5.2 | 5.2 |
| EBIT | 16.6 | 26.6 | -49.9 | -81.6 | -37.7 | -20.1 | -20.1 | -20.0 | -20.0 | -20.0 |
| EBIT, % | 3.42 | 4.13 | -7.22 | -14.44 | -8.52 | -4.53 | -4.53 | -4.53 | -4.53 | -4.53 |
| Total Cash | 122.4 | 85.5 | 59.2 | 91.1 | 106.3 | 77.2 | 77.2 | 77.2 | 77.1 | 77.1 |
| Total Cash, percent | .0 | .0 | .0 | .0 | .0 | .0 | .0 | .0 | .0 | .0 |
| Account Receivables | 100.9 | 104.9 | 100.3 | 83.3 | 87.1 | 76.2 | 76.2 | 76.1 | 76.1 | 76.1 |
| Account Receivables, % | 20.74 | 16.3 | 14.53 | 14.75 | 19.64 | 17.19 | 17.19 | 17.19 | 17.19 | 17.19 |
| Inventories | 152.1 | 204.7 | 238.2 | 136.4 | 112.6 | 130.4 | 130.3 | 130.3 | 130.3 | 130.2 |
| Inventories, % | 31.26 | 31.79 | 34.49 | 24.14 | 25.41 | 29.42 | 29.42 | 29.42 | 29.42 | 29.42 |
| Accounts Payable | 55.1 | 81.4 | 62.2 | 42.8 | 52.8 | 46.5 | 46.5 | 46.5 | 46.5 | 46.4 |
| Accounts Payable, % | 11.32 | 12.64 | 9 | 7.58 | 11.92 | 10.49 | 10.49 | 10.49 | 10.49 | 10.49 |
| Capital Expenditure | -19.8 | -31.5 | -17.8 | -11.2 | -10.4 | -14.1 | -14.1 | -14.1 | -14.1 | -14.0 |
| Capital Expenditure, % | -4.08 | -4.89 | -2.58 | -1.98 | -2.35 | -3.17 | -3.17 | -3.17 | -3.17 | -3.17 |
| Tax Rate, % | -2.24 | -2.24 | -2.24 | -2.24 | -2.24 | -2.24 | -2.24 | -2.24 | -2.24 | -2.24 |
| EBITAT | 9.7 | 25.4 | -51.2 | -101.1 | -38.6 | -18.2 | -18.2 | -18.2 | -18.2 | -18.2 |
| Depreciation | ||||||||||
| Changes in Account Receivables | ||||||||||
| Changes in Inventories | ||||||||||
| Changes in Accounts Payable | ||||||||||
| Capital Expenditure | ||||||||||
| UFCF | -178.5 | -1.1 | -80.7 | 17.2 | -1.8 | -22.4 | -9.2 | -9.2 | -9.2 | -9.2 |
| WACC, % | 2.69 | 3.8 | 3.93 | 3.93 | 3.93 | 3.65 | 3.65 | 3.65 | 3.65 | 3.65 |
| PV UFCF | ||||||||||
| SUM PV UFCF | -54.1 | |||||||||
| Long Term Growth Rate, % | 2.00 | |||||||||
| Free cash flow (T + 1) | -9 | |||||||||
| Terminal Value | -567 | |||||||||
| Present Terminal Value | -474 | |||||||||
| Enterprise Value | -528 | |||||||||
| Net Debt | 80 | |||||||||
| Equity Value | -608 | |||||||||
| Diluted Shares Outstanding, MM | 35 | |||||||||
| Equity Value Per Share | -17.59 |
What You Will Get
- Genuine Caesarstone Data: Preloaded financials – from revenue to EBIT – based on actual and projected figures.
- Complete Customization: Modify all essential parameters (yellow cells) such as WACC, growth %, and tax rates.
- Immediate Valuation Updates: Automatic recalculations to assess the impact of changes on Caesarstone’s fair value.
- Flexible Excel Template: Designed for quick edits, scenario analysis, and comprehensive projections.
- Efficient and Precise: Eliminate the need to build models from scratch while ensuring accuracy and adaptability.
Key Features
- Customizable Financial Inputs: Adjust essential metrics such as sales growth, gross margin %, and capital investments.
- Instant DCF Valuation: Quickly computes intrinsic value, NPV, and additional financial metrics.
- High-Precision Results: Leverages Caesarstone Ltd.’s (CSTE) actual financial data for accurate valuation insights.
- Effortless Scenario Testing: Easily evaluate various assumptions and analyze their impacts.
- Efficiency Booster: Avoid the hassle of constructing intricate valuation models from the ground up.
How It Works
- Download: Obtain the pre-built Excel file featuring Caesarstone Ltd.'s (CSTE) financial data.
- Customize: Modify forecasts, including revenue growth, EBITDA %, and WACC to fit your analysis.
- Update Automatically: The intrinsic value and NPV calculations refresh in real-time as you make changes.
- Test Scenarios: Develop various projections and instantly compare the results.
- Make Decisions: Utilize the valuation insights to inform your investment approach.
Why Choose This Calculator for Caesarstone Ltd. (CSTE)?
- User-Friendly Interface: Perfectly crafted for both novices and seasoned users.
- Customizable Variables: Adjust inputs seamlessly to suit your financial analysis.
- Real-Time Feedback: Watch Caesarstone’s valuation update instantly as you modify parameters.
- Preloaded Data: Comes equipped with Caesarstone’s actual financial metrics for swift evaluations.
- Preferred by Experts: A go-to tool for investors and analysts seeking reliable insights.
Who Should Use This Product?
- Individual Investors: Make informed decisions about buying or selling Caesarstone Ltd. (CSTE) stock.
- Financial Analysts: Streamline valuation processes with ready-to-use financial models specific to Caesarstone Ltd. (CSTE).
- Consultants: Deliver professional valuation insights regarding Caesarstone Ltd. (CSTE) to clients quickly and accurately.
- Business Owners: Understand how companies like Caesarstone Ltd. (CSTE) are valued to guide your own strategy.
- Finance Students: Learn valuation techniques using real-world data and scenarios involving Caesarstone Ltd. (CSTE).
What the Template Contains
- Pre-Filled Data: Includes Caesarstone Ltd.'s historical financials and forecasts.
- Discounted Cash Flow Model: Editable DCF valuation model with automatic calculations.
- Weighted Average Cost of Capital (WACC): A dedicated sheet for calculating WACC based on custom inputs.
- Key Financial Ratios: Analyze Caesarstone Ltd.'s profitability, efficiency, and leverage.
- Customizable Inputs: Edit revenue growth, margins, and tax rates with ease.
- Clear Dashboard: Charts and tables summarizing key valuation results.
Disclaimer
All information, articles, and product details provided on this website are for general informational and educational purposes only. We do not claim any ownership over, nor do we intend to infringe upon, any trademarks, copyrights, logos, brand names, or other intellectual property mentioned or depicted on this site. Such intellectual property remains the property of its respective owners, and any references here are made solely for identification or informational purposes, without implying any affiliation, endorsement, or partnership.
We make no representations or warranties, express or implied, regarding the accuracy, completeness, or suitability of any content or products presented. Nothing on this website should be construed as legal, tax, investment, financial, medical, or other professional advice. In addition, no part of this site—including articles or product references—constitutes a solicitation, recommendation, endorsement, advertisement, or offer to buy or sell any securities, franchises, or other financial instruments, particularly in jurisdictions where such activity would be unlawful.
All content is of a general nature and may not address the specific circumstances of any individual or entity. It is not a substitute for professional advice or services. Any actions you take based on the information provided here are strictly at your own risk. You accept full responsibility for any decisions or outcomes arising from your use of this website and agree to release us from any liability in connection with your use of, or reliance upon, the content or products found herein.