
|
Corteva ، Inc. (CTVA) تقييم DCF |
Fully Editable: Tailor To Your Needs In Excel Or Sheets
Professional Design: Trusted, Industry-Standard Templates
Investor-Approved Valuation Models
MAC/PC Compatible, Fully Unlocked
No Expertise Is Needed; Easy To Follow
Corteva, Inc. (CTVA) Bundle
عزز استراتيجيات الاستثمار الخاصة بك مع حاسبة Corteva ، Inc. (CTVA) DCF! استكشف البيانات المالية الحقيقية من Corteva ، وضبط توقعات النمو والنفقات ، ومراقبة الآثار الفورية على القيمة الجوهرية لكورتيفا.
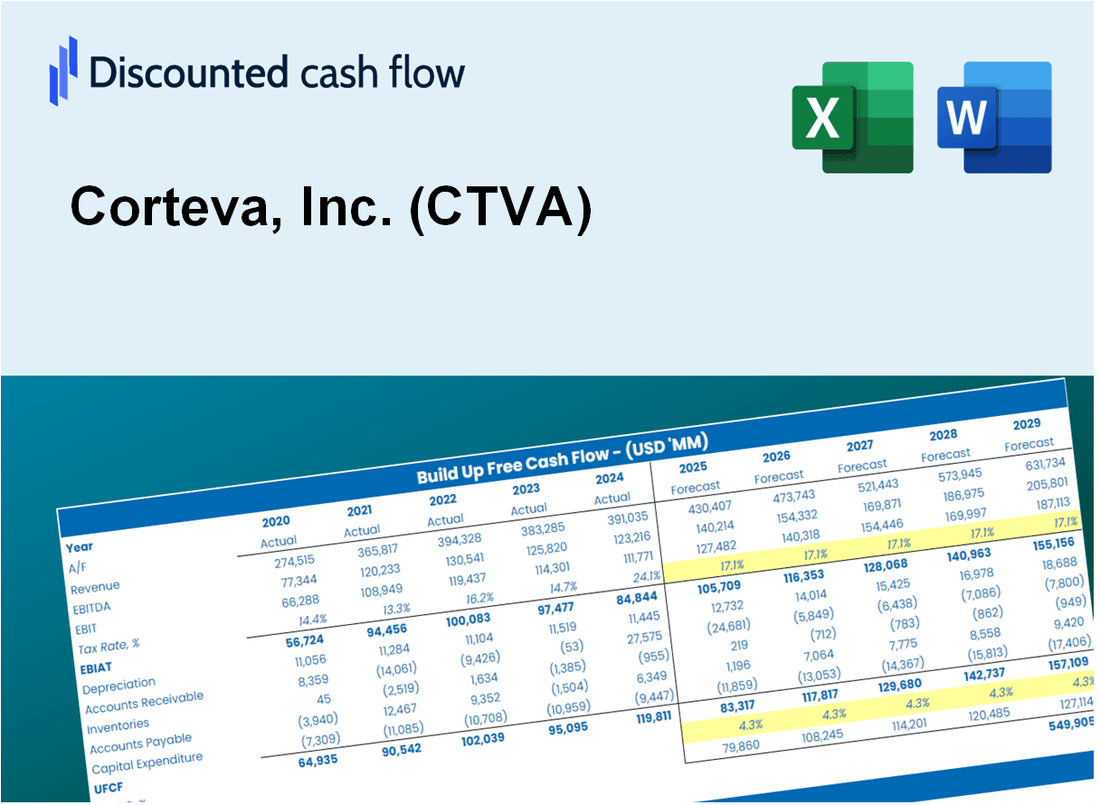
Discounted Cash Flow (DCF) - (USD MM)
| Year | AY1 2020 |
AY2 2021 |
AY3 2022 |
AY4 2023 |
AY5 2024 |
FY1 2025 |
FY2 2026 |
FY3 2027 |
FY4 2028 |
FY5 2029 |
|---|---|---|---|---|---|---|---|---|---|---|
| Revenue | 14,217.0 | 15,655.0 | 17,455.0 | 17,226.0 | 16,908.0 | 17,688.1 | 18,504.1 | 19,357.9 | 20,251.0 | 21,185.3 |
| Revenue Growth, % | 0 | 10.11 | 11.5 | -1.31 | -1.85 | 4.61 | 4.61 | 4.61 | 4.61 | 4.61 |
| EBITDA | 1,897.0 | 3,619.0 | 2,728.0 | 2,537.0 | 2,735.0 | 2,936.0 | 3,071.4 | 3,213.1 | 3,361.4 | 3,516.4 |
| EBITDA, % | 13.34 | 23.12 | 15.63 | 14.73 | 16.18 | 16.6 | 16.6 | 16.6 | 16.6 | 16.6 |
| Depreciation | 1,177.0 | 1,243.0 | 1,223.0 | 1,211.0 | 1,227.0 | 1,327.0 | 1,388.3 | 1,452.3 | 1,519.3 | 1,589.4 |
| Depreciation, % | 8.28 | 7.94 | 7.01 | 7.03 | 7.26 | 7.5 | 7.5 | 7.5 | 7.5 | 7.5 |
| EBIT | 720.0 | 2,376.0 | 1,505.0 | 1,326.0 | 1,508.0 | 1,608.9 | 1,683.1 | 1,760.8 | 1,842.0 | 1,927.0 |
| EBIT, % | 5.06 | 15.18 | 8.62 | 7.7 | 8.92 | 9.1 | 9.1 | 9.1 | 9.1 | 9.1 |
| Total Cash | 3,795.0 | 4,545.0 | 3,315.0 | 2,742.0 | 3,169.0 | 3,869.4 | 4,047.9 | 4,234.6 | 4,430.0 | 4,634.4 |
| Total Cash, percent | .0 | .0 | .0 | .0 | .0 | .0 | .0 | .0 | .0 | .0 |
| Account Receivables | 4,926.0 | 4,811.0 | 5,701.0 | 5,488.0 | 5,676.0 | 5,782.9 | 6,049.7 | 6,328.9 | 6,620.8 | 6,926.3 |
| Account Receivables, % | 34.65 | 30.73 | 32.66 | 31.86 | 33.57 | 32.69 | 32.69 | 32.69 | 32.69 | 32.69 |
| Inventories | 4,882.0 | 5,180.0 | 6,811.0 | 6,899.0 | 5,432.0 | 6,319.1 | 6,610.6 | 6,915.6 | 7,234.6 | 7,568.4 |
| Inventories, % | 34.34 | 33.09 | 39.02 | 40.05 | 32.13 | 35.72 | 35.72 | 35.72 | 35.72 | 35.72 |
| Accounts Payable | 3,615.0 | 4,126.0 | 4,895.0 | 4,280.0 | 4,039.0 | 4,548.0 | 4,757.8 | 4,977.3 | 5,207.0 | 5,447.2 |
| Accounts Payable, % | 25.43 | 26.36 | 28.04 | 24.85 | 23.89 | 25.71 | 25.71 | 25.71 | 25.71 | 25.71 |
| Capital Expenditure | -475.0 | -573.0 | -605.0 | -595.0 | -597.0 | -617.4 | -645.9 | -675.7 | -706.8 | -739.5 |
| Capital Expenditure, % | -3.34 | -3.66 | -3.47 | -3.45 | -3.53 | -3.49 | -3.49 | -3.49 | -3.49 | -3.49 |
| Tax Rate, % | 28.86 | 28.86 | 28.86 | 28.86 | 28.86 | 28.86 | 28.86 | 28.86 | 28.86 | 28.86 |
| EBITAT | 726.4 | 1,781.5 | 1,210.5 | 891.7 | 1,072.7 | 1,267.2 | 1,325.6 | 1,386.8 | 1,450.8 | 1,517.7 |
| Depreciation | ||||||||||
| Changes in Account Receivables | ||||||||||
| Changes in Inventories | ||||||||||
| Changes in Accounts Payable | ||||||||||
| Capital Expenditure | ||||||||||
| UFCF | -4,764.6 | 2,779.5 | 76.5 | 1,017.7 | 2,740.7 | 1,491.8 | 1,719.5 | 1,798.8 | 1,881.8 | 1,968.7 |
| WACC, % | 7.35 | 7.23 | 7.25 | 7.19 | 7.21 | 7.24 | 7.24 | 7.24 | 7.24 | 7.24 |
| PV UFCF | ||||||||||
| SUM PV UFCF | 7,154.9 | |||||||||
| Long Term Growth Rate, % | 3.50 | |||||||||
| Free cash flow (T + 1) | 2,038 | |||||||||
| Terminal Value | 54,425 | |||||||||
| Present Terminal Value | 38,365 | |||||||||
| Enterprise Value | 45,520 | |||||||||
| Net Debt | -403 | |||||||||
| Equity Value | 45,923 | |||||||||
| Diluted Shares Outstanding, MM | 696 | |||||||||
| Equity Value Per Share | 65.98 |
What You Will Get
- Real CTVA Financial Data: Pre-filled with Corteva’s historical and projected data for precise analysis.
- Fully Editable Template: Modify key inputs like revenue growth, WACC, and EBITDA % with ease.
- Automatic Calculations: See Corteva’s intrinsic value update instantly based on your changes.
- Professional Valuation Tool: Designed for investors, analysts, and consultants seeking accurate DCF results.
- User-Friendly Design: Simple structure and clear instructions for all experience levels.
Key Features
- Comprehensive Data: Corteva’s historical financial reports and pre-filled projections.
- Customizable Parameters: Modify WACC, tax rates, revenue growth, and EBITDA margins as needed.
- Real-Time Insights: Observe Corteva’s intrinsic value recalculating instantly.
- Intuitive Visuals: Dashboard graphs present valuation outcomes and essential metrics clearly.
- Designed for Precision: A professional-grade tool for analysts, investors, and finance professionals.
How It Works
- Step 1: Download the prebuilt Excel template with Corteva’s data included.
- Step 2: Explore the pre-filled sheets and understand the key metrics.
- Step 3: Update forecasts and assumptions in the editable yellow cells (WACC, growth, margins).
- Step 4: Instantly view recalculated results, including Corteva’s intrinsic value.
- Step 5: Make informed investment decisions or generate reports using the outputs.
Why Choose This Calculator for Corteva, Inc. (CTVA)?
- Accuracy: Utilizes authentic Corteva financials to guarantee precise data.
- Flexibility: Built for users to easily experiment with and adjust inputs.
- Time-Saving: Eliminate the burden of creating a DCF model from the ground up.
- Professional-Grade: Crafted with the expertise and usability expected by CFOs.
- User-Friendly: Intuitive design makes it accessible for users with varying levels of financial modeling skills.
Who Should Use This Product?
- Investors: Accurately assess Corteva's (CTVA) fair value prior to making investment choices.
- CFOs: Utilize a top-tier DCF model for financial reporting and strategic analysis.
- Consultants: Efficiently customize the template for client valuation reports.
- Entrepreneurs: Acquire insights into financial modeling practices employed by leading agricultural companies.
- Educators: Implement it as a teaching resource to illustrate valuation techniques.
What the Template Contains
- Operating and Balance Sheet Data: Pre-filled Corteva historical data and forecasts, including revenue, EBITDA, EBIT, and capital expenditures.
- WACC Calculation: A dedicated sheet for Weighted Average Cost of Capital (WACC), including parameters like Beta, risk-free rate, and share price.
- DCF Valuation (Unlevered and Levered): Editable Discounted Cash Flow models showing intrinsic value with detailed calculations.
- Financial Statements: Pre-loaded financial statements (annual and quarterly) to support analysis.
- Key Ratios: Includes profitability, leverage, and efficiency ratios for Corteva, Inc. (CTVA).
- Dashboard and Charts: Visual summary of valuation outputs and assumptions to analyze results easily.
Disclaimer
All information, articles, and product details provided on this website are for general informational and educational purposes only. We do not claim any ownership over, nor do we intend to infringe upon, any trademarks, copyrights, logos, brand names, or other intellectual property mentioned or depicted on this site. Such intellectual property remains the property of its respective owners, and any references here are made solely for identification or informational purposes, without implying any affiliation, endorsement, or partnership.
We make no representations or warranties, express or implied, regarding the accuracy, completeness, or suitability of any content or products presented. Nothing on this website should be construed as legal, tax, investment, financial, medical, or other professional advice. In addition, no part of this site—including articles or product references—constitutes a solicitation, recommendation, endorsement, advertisement, or offer to buy or sell any securities, franchises, or other financial instruments, particularly in jurisdictions where such activity would be unlawful.
All content is of a general nature and may not address the specific circumstances of any individual or entity. It is not a substitute for professional advice or services. Any actions you take based on the information provided here are strictly at your own risk. You accept full responsibility for any decisions or outcomes arising from your use of this website and agree to release us from any liability in connection with your use of, or reliance upon, the content or products found herein.