
|
Cemex ، S.A.B. دي سي. (CX) تقييم DCF |
Fully Editable: Tailor To Your Needs In Excel Or Sheets
Professional Design: Trusted, Industry-Standard Templates
Investor-Approved Valuation Models
MAC/PC Compatible, Fully Unlocked
No Expertise Is Needed; Easy To Follow
CEMEX, S.A.B. de C.V. (CX) Bundle
كمستثمر أو محلل ، The Cemex ، S.A.B. دي سي. (CX) حاسبة DCF هي مورد الانتقال الخاص بك للتقييم الدقيق. مزودًا ببيانات حقيقية من CEMEX ، يمكنك بسهولة ضبط التوقعات ومراقبة التأثيرات في الوقت الفعلي.
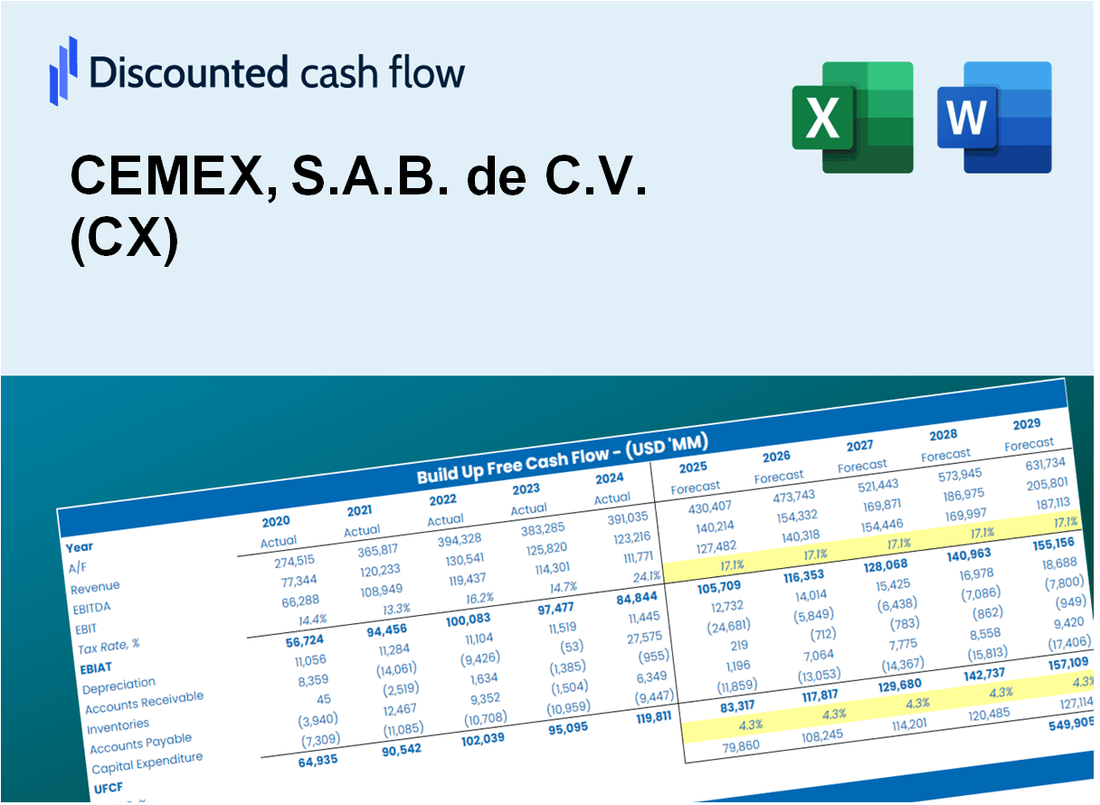
Discounted Cash Flow (DCF) - (USD MM)
| Year | AY1 2020 |
AY2 2021 |
AY3 2022 |
AY4 2023 |
AY5 2024 |
FY1 2025 |
FY2 2026 |
FY3 2027 |
FY4 2028 |
FY5 2029 |
|---|---|---|---|---|---|---|---|---|---|---|
| Revenue | 12,970.0 | 14,548.0 | 15,577.0 | 17,388.0 | 16,200.0 | 17,173.4 | 18,205.2 | 19,299.0 | 20,458.6 | 21,687.8 |
| Revenue Growth, % | 0 | 12.17 | 7.07 | 11.63 | -6.83 | 6.01 | 6.01 | 6.01 | 6.01 | 6.01 |
| EBITDA | 595.0 | 2,681.0 | 2,424.0 | 3,257.0 | 2,675.0 | 2,535.5 | 2,687.9 | 2,849.4 | 3,020.6 | 3,202.0 |
| EBITDA, % | 4.59 | 18.43 | 15.56 | 18.73 | 16.51 | 14.76 | 14.76 | 14.76 | 14.76 | 14.76 |
| Depreciation | 1,105.0 | 1,120.0 | 1,120.0 | 1,233.0 | 887.0 | 1,235.6 | 1,309.9 | 1,388.6 | 1,472.0 | 1,560.4 |
| Depreciation, % | 8.52 | 7.7 | 7.19 | 7.09 | 5.48 | 7.19 | 7.19 | 7.19 | 7.19 | 7.19 |
| EBIT | -510.0 | 1,561.0 | 1,304.0 | 2,024.0 | 1,788.0 | 1,299.9 | 1,378.0 | 1,460.8 | 1,548.6 | 1,641.6 |
| EBIT, % | -3.93 | 10.73 | 8.37 | 11.64 | 11.04 | 7.57 | 7.57 | 7.57 | 7.57 | 7.57 |
| Total Cash | 950.0 | 613.0 | 495.0 | 624.0 | 864.0 | 811.9 | 860.7 | 912.4 | 967.2 | 1,025.3 |
| Total Cash, percent | .0 | .0 | .0 | .0 | .0 | .0 | .0 | .0 | .0 | .0 |
| Account Receivables | 2,010.0 | 1,683.0 | 1,844.0 | 1,929.0 | 1,803.0 | 2,099.5 | 2,225.7 | 2,359.4 | 2,501.2 | 2,651.4 |
| Account Receivables, % | 15.5 | 11.57 | 11.84 | 11.09 | 11.13 | 12.23 | 12.23 | 12.23 | 12.23 | 12.23 |
| Inventories | 1,088.0 | 1,392.0 | 1,783.0 | 1,789.0 | 1,485.0 | 1,678.1 | 1,779.0 | 1,885.8 | 1,999.2 | 2,119.3 |
| Inventories, % | 8.39 | 9.57 | 11.45 | 10.29 | 9.17 | 9.77 | 9.77 | 9.77 | 9.77 | 9.77 |
| Accounts Payable | 2,571.0 | 2,762.0 | 2,966.0 | 3,109.0 | 3,090.0 | 3,256.2 | 3,451.8 | 3,659.2 | 3,879.1 | 4,112.1 |
| Accounts Payable, % | 19.82 | 18.99 | 19.04 | 17.88 | 19.07 | 18.96 | 18.96 | 18.96 | 18.96 | 18.96 |
| Capital Expenditure | -591.0 | -993.0 | -1,060.0 | -1,175.0 | -1,296.0 | -1,131.5 | -1,199.5 | -1,271.6 | -1,348.0 | -1,429.0 |
| Capital Expenditure, % | -4.56 | -6.83 | -6.8 | -6.76 | -8 | -6.59 | -6.59 | -6.59 | -6.59 | -6.59 |
| Tax Rate, % | 4.18 | 4.18 | 4.18 | 4.18 | 4.18 | 4.18 | 4.18 | 4.18 | 4.18 | 4.18 |
| EBITAT | -587.3 | 1,261.2 | 1,453.0 | 254.2 | 1,713.2 | 1,011.8 | 1,072.6 | 1,137.0 | 1,205.3 | 1,277.7 |
| Depreciation | ||||||||||
| Changes in Account Receivables | ||||||||||
| Changes in Inventories | ||||||||||
| Changes in Accounts Payable | ||||||||||
| Capital Expenditure | ||||||||||
| UFCF | -600.3 | 1,602.2 | 1,165.0 | 364.2 | 1,715.2 | 792.4 | 1,151.5 | 1,220.7 | 1,294.1 | 1,371.8 |
| WACC, % | 8.25 | 6.96 | 8.25 | 2.36 | 7.97 | 6.76 | 6.76 | 6.76 | 6.76 | 6.76 |
| PV UFCF | ||||||||||
| SUM PV UFCF | 4,741.6 | |||||||||
| Long Term Growth Rate, % | 2.00 | |||||||||
| Free cash flow (T + 1) | 1,399 | |||||||||
| Terminal Value | 29,421 | |||||||||
| Present Terminal Value | 21,218 | |||||||||
| Enterprise Value | 25,959 | |||||||||
| Net Debt | 6,494 | |||||||||
| Equity Value | 19,465 | |||||||||
| Diluted Shares Outstanding, MM | 147 | |||||||||
| Equity Value Per Share | 132.52 |
What You Will Get
- Real CEMEX Data: Preloaded financials – from revenue to EBIT – based on actual and projected figures.
- Full Customization: Adjust all critical parameters (yellow cells) like WACC, growth %, and tax rates.
- Instant Valuation Updates: Automatic recalculations to analyze the impact of changes on CEMEX’s fair value.
- Versatile Excel Template: Tailored for quick edits, scenario testing, and detailed projections.
- Time-Saving and Accurate: Skip building models from scratch while maintaining precision and flexibility.
Key Features
- Real-Life CX Data: Pre-filled with CEMEX’s historical financials and future projections.
- Fully Customizable Inputs: Modify revenue growth, profit margins, WACC, tax rates, and capital expenditures.
- Dynamic Valuation Model: Automatic updates to Net Present Value (NPV) and intrinsic value based on your adjustments.
- Scenario Testing: Develop multiple forecasting scenarios to evaluate various valuation results.
- User-Friendly Design: Intuitive, organized, and crafted for both professionals and novices.
How It Works
- Step 1: Download the Excel file.
- Step 2: Review pre-entered CEMEX data (historical and projected).
- Step 3: Adjust key assumptions (yellow cells) based on your analysis.
- Step 4: View automatic recalculations for CEMEX’s intrinsic value.
- Step 5: Use the outputs for investment decisions or reporting.
Why Choose This Calculator for CEMEX, S.A.B. de C.V. (CX)?
- Designed for Industry Experts: A sophisticated tool favored by construction analysts, financial officers, and industry consultants.
- Comprehensive Data: CEMEX’s historical and projected financials are preloaded for enhanced precision.
- Flexible Scenario Analysis: Effortlessly simulate various forecasts and assumptions.
- Insightful Outputs: Automatically computes intrinsic value, NPV, and essential financial metrics.
- User-Friendly: Clear, step-by-step instructions make navigation simple.
Who Should Use This Product?
- Construction Management Students: Understand project financing and apply valuation techniques using real data related to CEMEX, S.A.B. de C.V. (CX).
- Researchers: Integrate industry-specific models into academic studies or market analysis.
- Investors: Evaluate your investment strategies and analyze valuation scenarios for CEMEX, S.A.B. de C.V. (CX) stock.
- Financial Analysts: Enhance your analysis process with a customizable DCF model tailored for CEMEX, S.A.B. de C.V. (CX).
- Construction Industry Professionals: Gain valuable insights into how major companies like CEMEX, S.A.B. de C.V. (CX) are assessed in the market.
What the Template Contains
- Operating and Balance Sheet Data: Pre-filled CEMEX historical data and forecasts, including revenue, EBITDA, EBIT, and capital expenditures.
- WACC Calculation: A dedicated sheet for Weighted Average Cost of Capital (WACC), including parameters like Beta, risk-free rate, and share price.
- DCF Valuation (Unlevered and Levered): Editable Discounted Cash Flow models showing intrinsic value with detailed calculations.
- Financial Statements: Pre-loaded financial statements (annual and quarterly) to support analysis.
- Key Ratios: Includes profitability, leverage, and efficiency ratios for CEMEX, S.A.B. de C.V. (CX).
- Dashboard and Charts: Visual summary of valuation outputs and assumptions to analyze results easily.
Disclaimer
All information, articles, and product details provided on this website are for general informational and educational purposes only. We do not claim any ownership over, nor do we intend to infringe upon, any trademarks, copyrights, logos, brand names, or other intellectual property mentioned or depicted on this site. Such intellectual property remains the property of its respective owners, and any references here are made solely for identification or informational purposes, without implying any affiliation, endorsement, or partnership.
We make no representations or warranties, express or implied, regarding the accuracy, completeness, or suitability of any content or products presented. Nothing on this website should be construed as legal, tax, investment, financial, medical, or other professional advice. In addition, no part of this site—including articles or product references—constitutes a solicitation, recommendation, endorsement, advertisement, or offer to buy or sell any securities, franchises, or other financial instruments, particularly in jurisdictions where such activity would be unlawful.
All content is of a general nature and may not address the specific circumstances of any individual or entity. It is not a substitute for professional advice or services. Any actions you take based on the information provided here are strictly at your own risk. You accept full responsibility for any decisions or outcomes arising from your use of this website and agree to release us from any liability in connection with your use of, or reliance upon, the content or products found herein.