
|
Delta Air Lines ، Inc. (DAL) DCF تقييم |
Fully Editable: Tailor To Your Needs In Excel Or Sheets
Professional Design: Trusted, Industry-Standard Templates
Investor-Approved Valuation Models
MAC/PC Compatible, Fully Unlocked
No Expertise Is Needed; Easy To Follow
Delta Air Lines, Inc. (DAL) Bundle
تبسيط التقييم Delta Air Lines ، Inc. (DAL) مع هذه الآلة الحاسبة DCF القابلة للتخصيص! يضم Delta Air Lines ، Inc. (DAL) ومدخلات التنبؤ القابلة للتعديل ، يمكنك اختبار السيناريوهات وكشف القيمة العادلة Delta Air Lines ، Inc. (DAL) في دقائق.
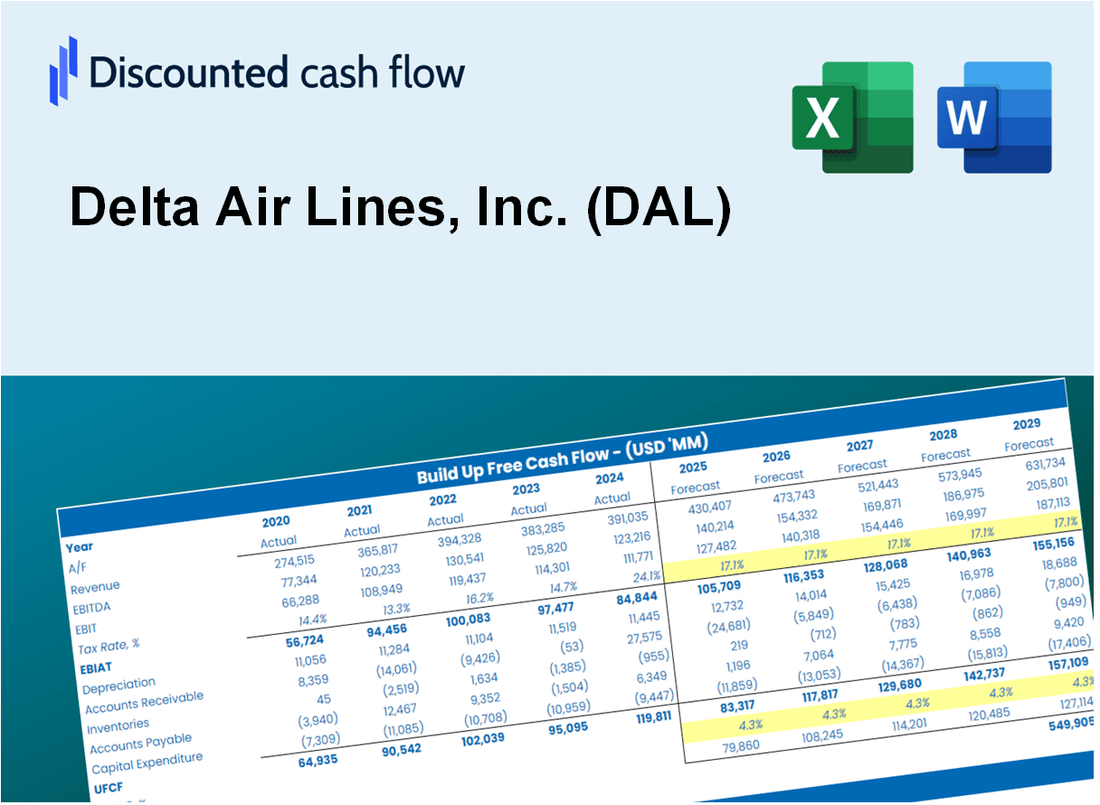
Discounted Cash Flow (DCF) - (USD MM)
| Year | AY1 2020 |
AY2 2021 |
AY3 2022 |
AY4 2023 |
AY5 2024 |
FY1 2025 |
FY2 2026 |
FY3 2027 |
FY4 2028 |
FY5 2029 |
|---|---|---|---|---|---|---|---|---|---|---|
| Revenue | 17,095.0 | 29,899.0 | 50,582.0 | 58,048.0 | 61,643.0 | 87,075.2 | 122,999.9 | 173,746.2 | 245,428.9 | 346,685.9 |
| Revenue Growth, % | 0 | 74.9 | 69.18 | 14.76 | 6.19 | 41.26 | 41.26 | 41.26 | 41.26 | 41.26 |
| EBITDA | -12,346.0 | 3,675.0 | 5,050.0 | 8,783.0 | 7,918.0 | 1,741.5 | 2,460.0 | 3,474.9 | 4,908.6 | 6,933.7 |
| EBITDA, % | -72.22 | 12.29 | 9.98 | 15.13 | 12.84 | 2 | 2 | 2 | 2 | 2 |
| Depreciation | 2,312.0 | 1,998.0 | 2,107.0 | 2,341.0 | 2,513.0 | 5,656.8 | 7,990.6 | 11,287.2 | 15,944.0 | 22,522.1 |
| Depreciation, % | 13.52 | 6.68 | 4.17 | 4.03 | 4.08 | 6.5 | 6.5 | 6.5 | 6.5 | 6.5 |
| EBIT | -14,658.0 | 1,677.0 | 2,943.0 | 6,442.0 | 5,405.0 | 1,741.5 | 2,460.0 | 3,474.9 | 4,908.6 | 6,933.7 |
| EBIT, % | -85.74 | 5.61 | 5.82 | 11.1 | 8.77 | 2 | 2 | 2 | 2 | 2 |
| Total Cash | 14,096.0 | 11,319.0 | 6,534.0 | 3,868.0 | 3,069.0 | 25,229.9 | 35,639.0 | 50,342.6 | 71,112.6 | 100,451.6 |
| Total Cash, percent | .0 | .0 | .0 | .0 | .0 | .0 | .0 | .0 | .0 | .0 |
| Account Receivables | 1,396.0 | 2,404.0 | 3,176.0 | 3,130.0 | 3,224.0 | 14,802.8 | 20,910.0 | 29,536.8 | 41,722.9 | 58,936.6 |
| Account Receivables, % | 8.17 | 8.04 | 6.28 | 5.39 | 5.23 | 17 | 17 | 17 | 17 | 17 |
| Inventories | 732.0 | 1,098.0 | 1,424.0 | 1,314.0 | 1,428.0 | 2,673.2 | 3,776.0 | 5,333.9 | 7,534.5 | 10,643.1 |
| Inventories, % | 4.28 | 3.67 | 2.82 | 2.26 | 2.32 | 3.07 | 3.07 | 3.07 | 3.07 | 3.07 |
| Accounts Payable | 2,840.0 | 4,240.0 | 5,106.0 | 4,446.0 | 4,650.0 | 9,768.3 | 13,798.4 | 19,491.3 | 27,532.8 | 38,892.1 |
| Accounts Payable, % | 16.61 | 14.18 | 10.09 | 7.66 | 7.54 | 11.22 | 11.22 | 11.22 | 11.22 | 11.22 |
| Capital Expenditure | -1,899.0 | -3,247.0 | -6,366.0 | -5,323.0 | -5,140.0 | -3,483.0 | -4,920.0 | -6,949.8 | -9,817.2 | -13,867.4 |
| Capital Expenditure, % | -11.11 | -10.86 | -12.59 | -9.17 | -8.34 | -4 | -4 | -4 | -4 | -4 |
| Tax Rate, % | 25.78 | 25.78 | 25.78 | 25.78 | 25.78 | 25.78 | 25.78 | 25.78 | 25.78 | 25.78 |
| EBITAT | -11,646.8 | 1,179.8 | 2,026.6 | 5,294.4 | 4,011.4 | 1,306.4 | 1,845.4 | 2,606.7 | 3,682.1 | 5,201.3 |
| Depreciation | ||||||||||
| Changes in Account Receivables | ||||||||||
| Changes in Inventories | ||||||||||
| Changes in Accounts Payable | ||||||||||
| Capital Expenditure | ||||||||||
| UFCF | -10,521.8 | -43.2 | -2,464.4 | 1,808.4 | 1,380.4 | -4,225.5 | 1,736.0 | 2,452.2 | 3,463.9 | 4,893.0 |
| WACC, % | 7.54 | 7.41 | 7.39 | 7.58 | 7.47 | 7.48 | 7.48 | 7.48 | 7.48 | 7.48 |
| PV UFCF | ||||||||||
| SUM PV UFCF | 5,554.5 | |||||||||
| Long Term Growth Rate, % | 2.00 | |||||||||
| Free cash flow (T + 1) | 4,991 | |||||||||
| Terminal Value | 91,132 | |||||||||
| Present Terminal Value | 63,548 | |||||||||
| Enterprise Value | 69,103 | |||||||||
| Net Debt | 19,702 | |||||||||
| Equity Value | 49,401 | |||||||||
| Diluted Shares Outstanding, MM | 648 | |||||||||
| Equity Value Per Share | 76.24 |
What You Will Get
- Editable Forecast Inputs: Easily modify assumptions (growth %, margins, WACC) to explore various scenarios.
- Real-World Data: Delta Air Lines, Inc. (DAL)’s financial data pre-filled to kickstart your analysis.
- Automatic DCF Outputs: The template computes Net Present Value (NPV) and intrinsic value automatically.
- Customizable and Professional: A sleek Excel model that adjusts to your valuation requirements.
- Built for Analysts and Investors: Perfect for testing projections, validating strategies, and enhancing efficiency.
Key Features
- Customizable Flight Metrics: Adjust essential parameters such as passenger load factor, yield per passenger, and operational costs.
- Instant DCF Valuation: Automatically calculates intrinsic value, NPV, and other financial metrics in real-time.
- Industry-Leading Precision: Leverages Delta Air Lines’ actual financial data for accurate valuation results.
- Seamless Scenario Testing: Easily evaluate various assumptions and analyze potential outcomes.
- Efficiency Booster: Avoid the hassle of constructing intricate valuation models from the ground up.
How It Works
- Step 1: Download the Excel file.
- Step 2: Review Delta Air Lines, Inc.'s (DAL) pre-filled financial data and forecasts.
- Step 3: Adjust key inputs such as passenger revenue growth, operating expenses, and fuel costs (highlighted cells).
- Step 4: Observe the DCF model update in real-time as you modify your assumptions.
- Step 5: Evaluate the results and leverage the insights for your investment strategies.
Why Choose Delta Air Lines, Inc. (DAL)?
- Exceptional Service: Experience unparalleled customer service and support throughout your journey.
- Extensive Network: Access to a vast network of destinations, making travel convenient and efficient.
- Modern Fleet: Fly with confidence on our state-of-the-art aircraft designed for comfort and safety.
- Loyalty Benefits: Enjoy rewards and perks through our SkyMiles program for frequent travelers.
- Commitment to Sustainability: Join us in our efforts towards reducing environmental impact and promoting eco-friendly practices.
Who Should Use Delta Air Lines, Inc. (DAL)?
- Travelers: Enjoy a seamless flying experience with a trusted airline.
- Business Professionals: Utilize convenient flight options to maximize productivity on the go.
- Frequent Flyers: Take advantage of loyalty programs for exclusive perks and benefits.
- Travel Planners: Access comprehensive routes and schedules for effective itinerary planning.
- Students and Educators: Explore real-world applications of aviation and travel management concepts.
What the Template Contains
- Preloaded DAL Data: Historical and projected financial data, including revenue, EBIT, and capital expenditures.
- DCF and WACC Models: Professional-grade sheets for calculating intrinsic value and Weighted Average Cost of Capital.
- Editable Inputs: Yellow-highlighted cells for adjusting revenue growth, tax rates, and discount rates.
- Financial Statements: Comprehensive annual and quarterly financials for deeper analysis.
- Key Ratios: Profitability, leverage, and efficiency ratios to evaluate performance.
- Dashboard and Charts: Visual summaries of valuation outcomes and assumptions.
Disclaimer
All information, articles, and product details provided on this website are for general informational and educational purposes only. We do not claim any ownership over, nor do we intend to infringe upon, any trademarks, copyrights, logos, brand names, or other intellectual property mentioned or depicted on this site. Such intellectual property remains the property of its respective owners, and any references here are made solely for identification or informational purposes, without implying any affiliation, endorsement, or partnership.
We make no representations or warranties, express or implied, regarding the accuracy, completeness, or suitability of any content or products presented. Nothing on this website should be construed as legal, tax, investment, financial, medical, or other professional advice. In addition, no part of this site—including articles or product references—constitutes a solicitation, recommendation, endorsement, advertisement, or offer to buy or sell any securities, franchises, or other financial instruments, particularly in jurisdictions where such activity would be unlawful.
All content is of a general nature and may not address the specific circumstances of any individual or entity. It is not a substitute for professional advice or services. Any actions you take based on the information provided here are strictly at your own risk. You accept full responsibility for any decisions or outcomes arising from your use of this website and agree to release us from any liability in connection with your use of, or reliance upon, the content or products found herein.