
|
Dupont de Nemours ، Inc. (DD) DCF تقييم |
Fully Editable: Tailor To Your Needs In Excel Or Sheets
Professional Design: Trusted, Industry-Standard Templates
Investor-Approved Valuation Models
MAC/PC Compatible, Fully Unlocked
No Expertise Is Needed; Easy To Follow
DuPont de Nemours, Inc. (DD) Bundle
تكشف عن الإمكانات الحقيقية لـ Dupont de Nemours ، Inc. (DD) مع حاسبة DCF المهنية! اضبط الافتراضات الرئيسية واستكشاف السيناريوهات المختلفة وتقييم كيفية تأثير التغييرات على تقييم DuPont - كل ذلك ضمن قالب Excel واحد.
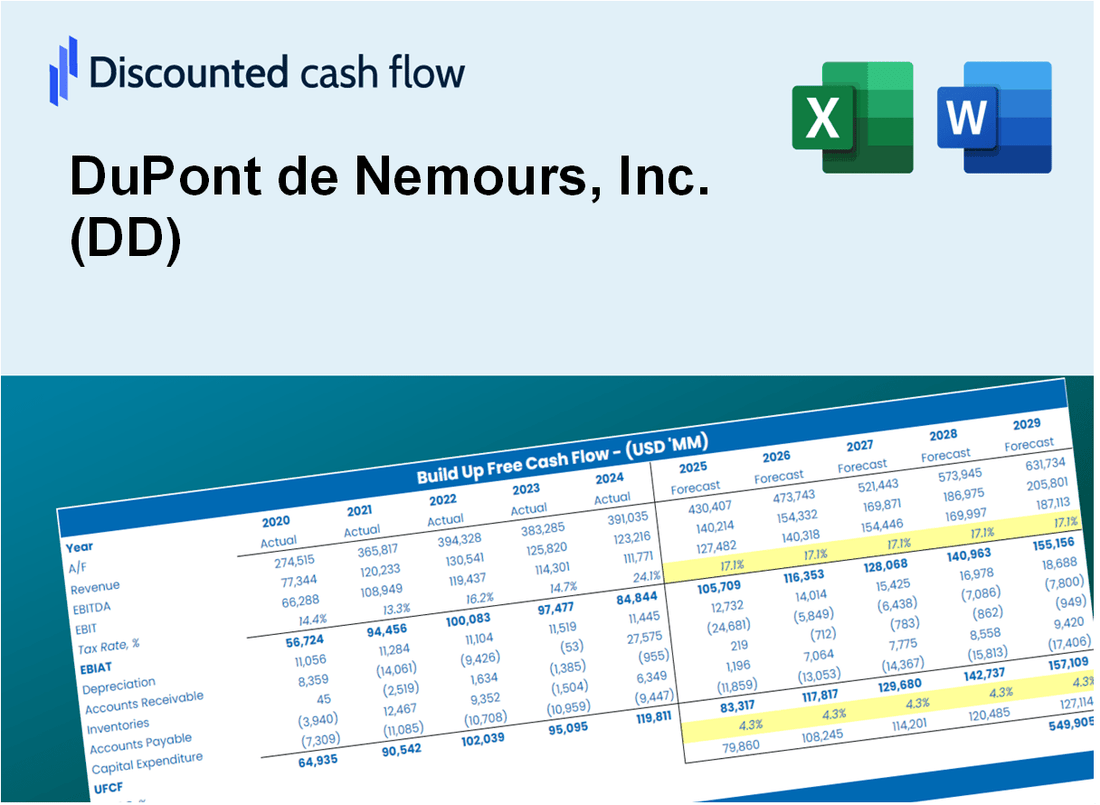
Discounted Cash Flow (DCF) - (USD MM)
| Year | AY1 2020 |
AY2 2021 |
AY3 2022 |
AY4 2023 |
AY5 2024 |
FY1 2025 |
FY2 2026 |
FY3 2027 |
FY4 2028 |
FY5 2029 |
|---|---|---|---|---|---|---|---|---|---|---|
| Revenue | 14,338.0 | 12,566.0 | 13,017.0 | 12,068.0 | 12,386.0 | 11,970.3 | 11,568.5 | 11,180.3 | 10,805.0 | 10,442.4 |
| Revenue Growth, % | 0 | -12.36 | 3.59 | -7.29 | 2.64 | -3.36 | -3.36 | -3.36 | -3.36 | -3.36 |
| EBITDA | -201.0 | 3,081.0 | 3,075.0 | 2,047.0 | 2,752.0 | 2,057.0 | 1,987.9 | 1,921.2 | 1,856.7 | 1,794.4 |
| EBITDA, % | -1.4 | 24.52 | 23.62 | 16.96 | 22.22 | 17.18 | 17.18 | 17.18 | 17.18 | 17.18 |
| Depreciation | 1,373.0 | 1,112.0 | 1,135.0 | 1,147.0 | 1,194.0 | 1,108.2 | 1,071.0 | 1,035.0 | 1,000.3 | 966.7 |
| Depreciation, % | 9.58 | 8.85 | 8.72 | 9.5 | 9.64 | 9.26 | 9.26 | 9.26 | 9.26 | 9.26 |
| EBIT | -1,574.0 | 1,969.0 | 1,940.0 | 900.0 | 1,558.0 | 948.8 | 917.0 | 886.2 | 856.4 | 827.7 |
| EBIT, % | -10.98 | 15.67 | 14.9 | 7.46 | 12.58 | 7.93 | 7.93 | 7.93 | 7.93 | 7.93 |
| Total Cash | 2,544.0 | 1,972.0 | 4,964.0 | 2,392.0 | 1,850.0 | 2,545.6 | 2,460.1 | 2,377.6 | 2,297.8 | 2,220.6 |
| Total Cash, percent | .0 | .0 | .0 | .0 | .0 | .0 | .0 | .0 | .0 | .0 |
| Account Receivables | 2,421.0 | 2,159.0 | 2,518.0 | 2,370.0 | 2,199.0 | 2,173.9 | 2,100.9 | 2,030.4 | 1,962.3 | 1,896.4 |
| Account Receivables, % | 16.89 | 17.18 | 19.34 | 19.64 | 17.75 | 18.16 | 18.16 | 18.16 | 18.16 | 18.16 |
| Inventories | 2,393.0 | 2,086.0 | 2,329.0 | 2,147.0 | 2,130.0 | 2,063.0 | 1,993.7 | 1,926.8 | 1,862.1 | 1,799.6 |
| Inventories, % | 16.69 | 16.6 | 17.89 | 17.79 | 17.2 | 17.23 | 17.23 | 17.23 | 17.23 | 17.23 |
| Accounts Payable | 2,222.0 | 2,102.0 | 2,103.0 | 1,675.0 | 1,720.0 | 1,823.0 | 1,761.8 | 1,702.7 | 1,645.5 | 1,590.3 |
| Accounts Payable, % | 15.5 | 16.73 | 16.16 | 13.88 | 13.89 | 15.23 | 15.23 | 15.23 | 15.23 | 15.23 |
| Capital Expenditure | -1,194.0 | -891.0 | -743.0 | -619.0 | -579.0 | -740.5 | -715.6 | -691.6 | -668.4 | -646.0 |
| Capital Expenditure, % | -8.33 | -7.09 | -5.71 | -5.13 | -4.67 | -6.19 | -6.19 | -6.19 | -6.19 | -6.19 |
| Tax Rate, % | 41.02 | 41.02 | 41.02 | 41.02 | 41.02 | 41.02 | 41.02 | 41.02 | 41.02 | 41.02 |
| EBITAT | -2,068.1 | 8,818.2 | 7,861.8 | 755.4 | 918.9 | 840.5 | 812.2 | 785.0 | 758.6 | 733.2 |
| Depreciation | ||||||||||
| Changes in Account Receivables | ||||||||||
| Changes in Inventories | ||||||||||
| Changes in Accounts Payable | ||||||||||
| Capital Expenditure | ||||||||||
| UFCF | -4,481.1 | 9,488.2 | 7,652.8 | 1,185.4 | 1,766.9 | 1,403.3 | 1,248.6 | 1,206.7 | 1,166.2 | 1,127.1 |
| WACC, % | 7.75 | 7.75 | 7.75 | 7.5 | 7.12 | 7.57 | 7.57 | 7.57 | 7.57 | 7.57 |
| PV UFCF | ||||||||||
| SUM PV UFCF | 5,006.1 | |||||||||
| Long Term Growth Rate, % | 4.00 | |||||||||
| Free cash flow (T + 1) | 1,172 | |||||||||
| Terminal Value | 32,797 | |||||||||
| Present Terminal Value | 22,766 | |||||||||
| Enterprise Value | 27,772 | |||||||||
| Net Debt | 5,321 | |||||||||
| Equity Value | 22,451 | |||||||||
| Diluted Shares Outstanding, MM | 421 | |||||||||
| Equity Value Per Share | 53.38 |
What You Will Get
- Pre-Filled Financial Model: DuPont de Nemours, Inc.'s (DD) actual data facilitates accurate DCF valuation.
- Full Forecast Control: Modify revenue growth, profit margins, WACC, and other essential drivers.
- Instant Calculations: Automatic updates provide immediate results as you adjust inputs.
- Investor-Ready Template: A polished Excel file crafted for high-quality valuation presentations.
- Customizable and Reusable: Designed for adaptability, allowing for repeated use in comprehensive forecasting.
Key Features
- 🔍 Real-Life DD Financials: Pre-filled historical and projected data for DuPont de Nemours, Inc. (DD).
- ✏️ Fully Customizable Inputs: Adjust all critical parameters (yellow cells) like WACC, growth %, and tax rates.
- 📊 Professional DCF Valuation: Built-in formulas calculate DuPont’s intrinsic value using the Discounted Cash Flow method.
- ⚡ Instant Results: Visualize DuPont’s valuation instantly after making changes.
- Scenario Analysis: Test and compare outcomes for various financial assumptions side-by-side.
How It Works
- Step 1: Download the Excel file.
- Step 2: Review pre-entered DuPont de Nemours, Inc. (DD) data (historical and projected).
- Step 3: Adjust key assumptions (yellow cells) based on your analysis.
- Step 4: View automatic recalculations for DuPont de Nemours, Inc. (DD)’s intrinsic value.
- Step 5: Use the outputs for investment decisions or reporting.
Why Choose This Calculator for DuPont de Nemours, Inc. (DD)?
- User-Friendly Interface: Tailored for both novices and seasoned professionals.
- Customizable Inputs: Adjust parameters effortlessly to suit your financial analysis.
- Real-Time Feedback: Watch DuPont's valuation change live as you tweak the inputs.
- Preloaded Data: Comes with DuPont’s latest financial information for immediate evaluation.
- Relied Upon by Experts: Favored by analysts and investors for making well-informed choices.
Who Should Use DuPont de Nemours, Inc. (DD)?
- Investors: Gain insights and make informed decisions with a trusted leader in innovation and sustainability.
- Financial Analysts: Utilize comprehensive reports and data to enhance your analysis of market trends.
- Consultants: Leverage DuPont's expertise to provide clients with cutting-edge solutions and strategies.
- Industry Professionals: Expand your knowledge of chemical and material sciences through DuPont's extensive resources.
- Educators and Students: Explore real-world applications of chemistry and engineering in your curriculum.
What the Template Contains
- Operating and Balance Sheet Data: Pre-filled DuPont de Nemours, Inc. (DD) historical data and forecasts, including revenue, EBITDA, EBIT, and capital expenditures.
- WACC Calculation: A dedicated sheet for Weighted Average Cost of Capital (WACC), including parameters like Beta, risk-free rate, and share price.
- DCF Valuation (Unlevered and Levered): Editable Discounted Cash Flow models showing intrinsic value with detailed calculations.
- Financial Statements: Pre-loaded financial statements (annual and quarterly) to support analysis.
- Key Ratios: Includes profitability, leverage, and efficiency ratios for DuPont de Nemours, Inc. (DD).
- Dashboard and Charts: Visual summary of valuation outputs and assumptions to analyze results easily.
Disclaimer
All information, articles, and product details provided on this website are for general informational and educational purposes only. We do not claim any ownership over, nor do we intend to infringe upon, any trademarks, copyrights, logos, brand names, or other intellectual property mentioned or depicted on this site. Such intellectual property remains the property of its respective owners, and any references here are made solely for identification or informational purposes, without implying any affiliation, endorsement, or partnership.
We make no representations or warranties, express or implied, regarding the accuracy, completeness, or suitability of any content or products presented. Nothing on this website should be construed as legal, tax, investment, financial, medical, or other professional advice. In addition, no part of this site—including articles or product references—constitutes a solicitation, recommendation, endorsement, advertisement, or offer to buy or sell any securities, franchises, or other financial instruments, particularly in jurisdictions where such activity would be unlawful.
All content is of a general nature and may not address the specific circumstances of any individual or entity. It is not a substitute for professional advice or services. Any actions you take based on the information provided here are strictly at your own risk. You accept full responsibility for any decisions or outcomes arising from your use of this website and agree to release us from any liability in connection with your use of, or reliance upon, the content or products found herein.