
|
شركة Journey Medical Corporation (DERM) DCF |
Fully Editable: Tailor To Your Needs In Excel Or Sheets
Professional Design: Trusted, Industry-Standard Templates
Investor-Approved Valuation Models
MAC/PC Compatible, Fully Unlocked
No Expertise Is Needed; Easy To Follow
Journey Medical Corporation (DERM) Bundle
استكشف النظرة المالية لشركة Journey Medical Corporation (DERM) مع حاسبة DCF سهلة الاستخدام! أدخل توقعاتك على النمو والهوامش والتكاليف لحساب القيمة الجوهرية لشركة الرحلة الطبية (DERM) وتشكيل نهج الاستثمار الخاص بك.
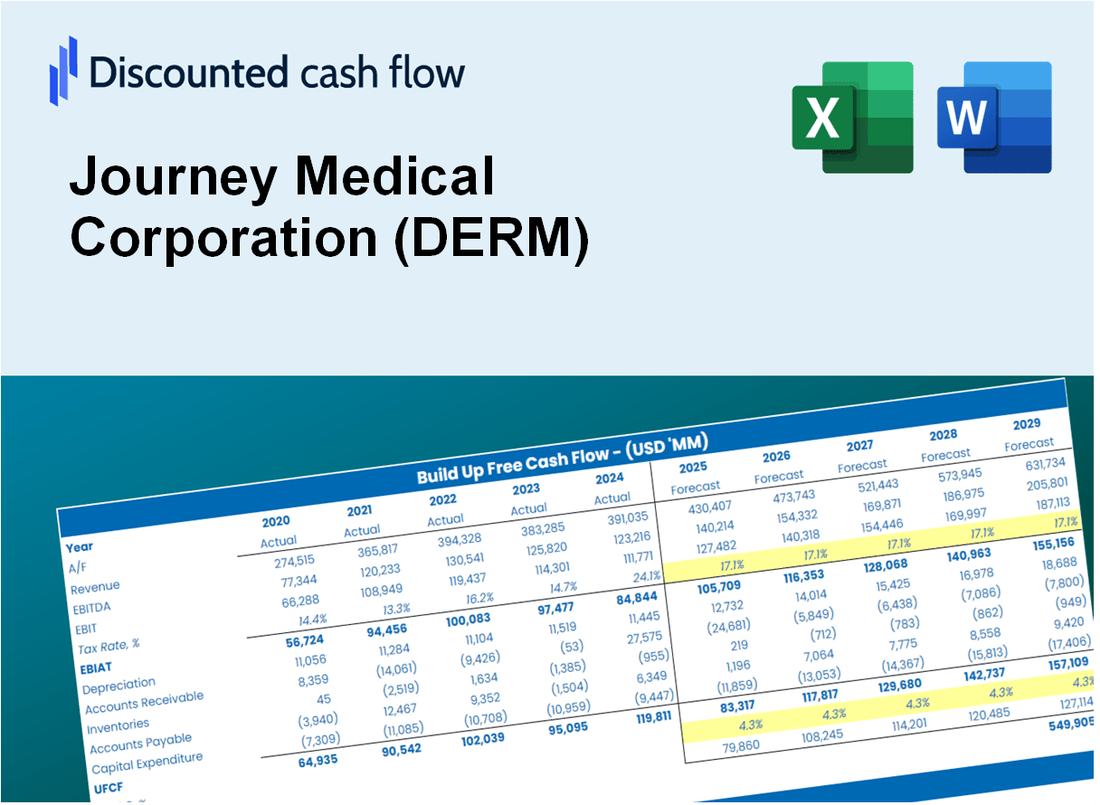
Discounted Cash Flow (DCF) - (USD MM)
| Year | AY1 2020 |
AY2 2021 |
AY3 2022 |
AY4 2023 |
AY5 2024 |
FY1 2025 |
FY2 2026 |
FY3 2027 |
FY4 2028 |
FY5 2029 |
|---|---|---|---|---|---|---|---|---|---|---|
| Revenue | 44.5 | 63.1 | 73.7 | 79.2 | 56.1 | 61.3 | 66.9 | 73.1 | 79.8 | 87.2 |
| Revenue Growth, % | 0 | 41.78 | 16.69 | 7.48 | -29.11 | 9.21 | 9.21 | 9.21 | 9.21 | 9.21 |
| EBITDA | 9.3 | -32.8 | -23.2 | 1.9 | -8.4 | -9.2 | -10.1 | -11.0 | -12.0 | -13.1 |
| EBITDA, % | 20.83 | -51.9 | -31.47 | 2.43 | -14.96 | -15.01 | -15.01 | -15.01 | -15.01 | -15.01 |
| Depreciation | 1.4 | 2.6 | 4.4 | 3.9 | 3.5 | 3.0 | 3.3 | 3.6 | 3.9 | 4.2 |
| Depreciation, % | 3.2 | 4.05 | 5.93 | 4.87 | 6.26 | 4.86 | 4.86 | 4.86 | 4.86 | 4.86 |
| EBIT | 7.9 | -35.3 | -27.5 | -1.9 | -11.9 | -12.2 | -13.3 | -14.5 | -15.9 | -17.3 |
| EBIT, % | 17.63 | -55.95 | -37.39 | -2.44 | -21.22 | -19.88 | -19.88 | -19.88 | -19.88 | -19.88 |
| Total Cash | 8.2 | 49.1 | 32.0 | 27.4 | 20.3 | 25.8 | 28.2 | 30.8 | 33.6 | 36.7 |
| Total Cash, percent | .0 | .0 | .0 | .0 | .0 | .0 | .0 | .0 | .0 | .0 |
| Account Receivables | 23.9 | 23.1 | 28.2 | 15.2 | 10.2 | 20.4 | 22.2 | 24.3 | 26.5 | 29.0 |
| Account Receivables, % | 53.73 | 36.61 | 38.29 | 19.22 | 18.23 | 33.22 | 33.22 | 33.22 | 33.22 | 33.22 |
| Inventories | 1.4 | 9.9 | 14.2 | 10.2 | 14.4 | 9.4 | 10.3 | 11.2 | 12.2 | 13.4 |
| Inventories, % | 3.15 | 15.62 | 19.22 | 12.89 | 25.71 | 15.32 | 15.32 | 15.32 | 15.32 | 15.32 |
| Accounts Payable | 2.0 | 22.8 | 37.0 | 16.1 | 16.1 | 17.1 | 18.7 | 20.4 | 22.3 | 24.4 |
| Accounts Payable, % | 4.39 | 36.13 | 50.2 | 20.31 | 28.59 | 27.93 | 27.93 | 27.93 | 27.93 | 27.93 |
| Capital Expenditure | -1.2 | -10.0 | -20.0 | -5.0 | -15.0 | -9.7 | -10.5 | -11.5 | -12.6 | -13.7 |
| Capital Expenditure, % | -2.69 | -15.84 | -27.15 | -6.31 | -26.72 | -15.74 | -15.74 | -15.74 | -15.74 | -15.74 |
| Tax Rate, % | -0.41749 | -0.41749 | -0.41749 | -0.41749 | -0.41749 | -0.41749 | -0.41749 | -0.41749 | -0.41749 | -0.41749 |
| EBITAT | 5.8 | -36.7 | -27.6 | -2.1 | -12.0 | -11.5 | -12.6 | -13.8 | -15.0 | -16.4 |
| Depreciation | ||||||||||
| Changes in Account Receivables | ||||||||||
| Changes in Inventories | ||||||||||
| Changes in Accounts Payable | ||||||||||
| Capital Expenditure | ||||||||||
| UFCF | -17.4 | -30.9 | -38.5 | -7.2 | -22.7 | -22.2 | -21.1 | -23.0 | -25.1 | -27.4 |
| WACC, % | 7.59 | 7.96 | 7.96 | 7.96 | 7.96 | 7.89 | 7.89 | 7.89 | 7.89 | 7.89 |
| PV UFCF | ||||||||||
| SUM PV UFCF | -94.3 | |||||||||
| Long Term Growth Rate, % | 2.00 | |||||||||
| Free cash flow (T + 1) | -28 | |||||||||
| Terminal Value | -475 | |||||||||
| Present Terminal Value | -325 | |||||||||
| Enterprise Value | -419 | |||||||||
| Net Debt | 5 | |||||||||
| Equity Value | -425 | |||||||||
| Diluted Shares Outstanding, MM | 20 | |||||||||
| Equity Value Per Share | -20.79 |
What You Will Get
- Real DERM Financials: Access to historical and projected data for precise valuation.
- Customizable Inputs: Adjust WACC, tax rates, revenue growth, and capital expenditures as needed.
- Dynamic Calculations: Intrinsic value and NPV are computed in real-time.
- Scenario Analysis: Evaluate various scenarios to assess Journey Medical Corporation's future performance.
- User-Friendly Design: Designed for professionals while remaining approachable for newcomers.
Key Features
- Comprehensive DCF Calculator: Features both unlevered and levered DCF valuation models tailored for Journey Medical Corporation (DERM).
- WACC Calculator: Includes a pre-configured Weighted Average Cost of Capital sheet with adjustable inputs.
- Customizable Forecast Assumptions: Easily alter growth rates, capital expenditures, and discount rates.
- Integrated Financial Ratios: Evaluate profitability, leverage, and efficiency ratios specific to Journey Medical Corporation (DERM).
- Interactive Dashboard and Charts: Visual representations highlight essential valuation metrics for straightforward analysis.
How It Works
- Step 1: Download the prebuilt Excel template featuring Journey Medical Corporation’s (DERM) data.
- Step 2: Navigate through the pre-filled sheets to grasp the essential metrics.
- Step 3: Modify forecasts and assumptions in the editable yellow cells (WACC, growth, margins).
- Step 4: Instantly see recalculated results, including Journey Medical Corporation’s (DERM) intrinsic value.
- Step 5: Make informed investment choices or create reports based on the outputs.
Why Choose This Calculator?
- Accuracy: Utilizes real Journey Medical Corporation (DERM) financials to ensure data precision.
- Flexibility: Tailored for users to easily adjust and test various inputs.
- Time-Saving: Avoid the complexity of constructing a DCF model from the ground up.
- Professional-Grade: Crafted with the precision and usability expected at the CFO level.
- User-Friendly: Intuitive design makes it accessible for individuals without extensive financial modeling skills.
Who Should Use This Product?
- Investors: Assess Journey Medical Corporation’s (DERM) valuation before making investment decisions.
- CFOs and Financial Analysts: Optimize valuation methodologies and evaluate financial forecasts.
- Startup Founders: Discover how established companies like Journey Medical Corporation are valued in the market.
- Consultants: Create detailed valuation reports for clients using Journey Medical Corporation’s (DERM) data.
- Students and Educators: Utilize real-time data to learn and teach valuation strategies effectively.
What the Template Contains
- Pre-Filled Data: Includes Journey Medical Corporation’s historical financials and forecasts.
- Discounted Cash Flow Model: Editable DCF valuation model with automatic calculations.
- Weighted Average Cost of Capital (WACC): A dedicated sheet for calculating WACC based on custom inputs.
- Key Financial Ratios: Analyze Journey Medical Corporation’s profitability, efficiency, and leverage.
- Customizable Inputs: Edit revenue growth, margins, and tax rates with ease.
- Clear Dashboard: Charts and tables summarizing key valuation results.
Disclaimer
All information, articles, and product details provided on this website are for general informational and educational purposes only. We do not claim any ownership over, nor do we intend to infringe upon, any trademarks, copyrights, logos, brand names, or other intellectual property mentioned or depicted on this site. Such intellectual property remains the property of its respective owners, and any references here are made solely for identification or informational purposes, without implying any affiliation, endorsement, or partnership.
We make no representations or warranties, express or implied, regarding the accuracy, completeness, or suitability of any content or products presented. Nothing on this website should be construed as legal, tax, investment, financial, medical, or other professional advice. In addition, no part of this site—including articles or product references—constitutes a solicitation, recommendation, endorsement, advertisement, or offer to buy or sell any securities, franchises, or other financial instruments, particularly in jurisdictions where such activity would be unlawful.
All content is of a general nature and may not address the specific circumstances of any individual or entity. It is not a substitute for professional advice or services. Any actions you take based on the information provided here are strictly at your own risk. You accept full responsibility for any decisions or outcomes arising from your use of this website and agree to release us from any liability in connection with your use of, or reliance upon, the content or products found herein.