
|
Draftings Inc. (DKNG) تقييم DCF |
Fully Editable: Tailor To Your Needs In Excel Or Sheets
Professional Design: Trusted, Industry-Standard Templates
Investor-Approved Valuation Models
MAC/PC Compatible, Fully Unlocked
No Expertise Is Needed; Easy To Follow
DraftKings Inc. (DKNG) Bundle
تبسيط DraftKings Inc. تقييم (DKNG) باستخدام حاسبة DCF القابلة للتخصيص! يضم شركة DraftKings Inc. (DKNG) المالية ومدخلات التوقعات القابلة للتعديل، يمكنك اختبار السيناريوهات والكشف عن DraftKings Inc. (DKNG) القيمة العادلة في دقائق.
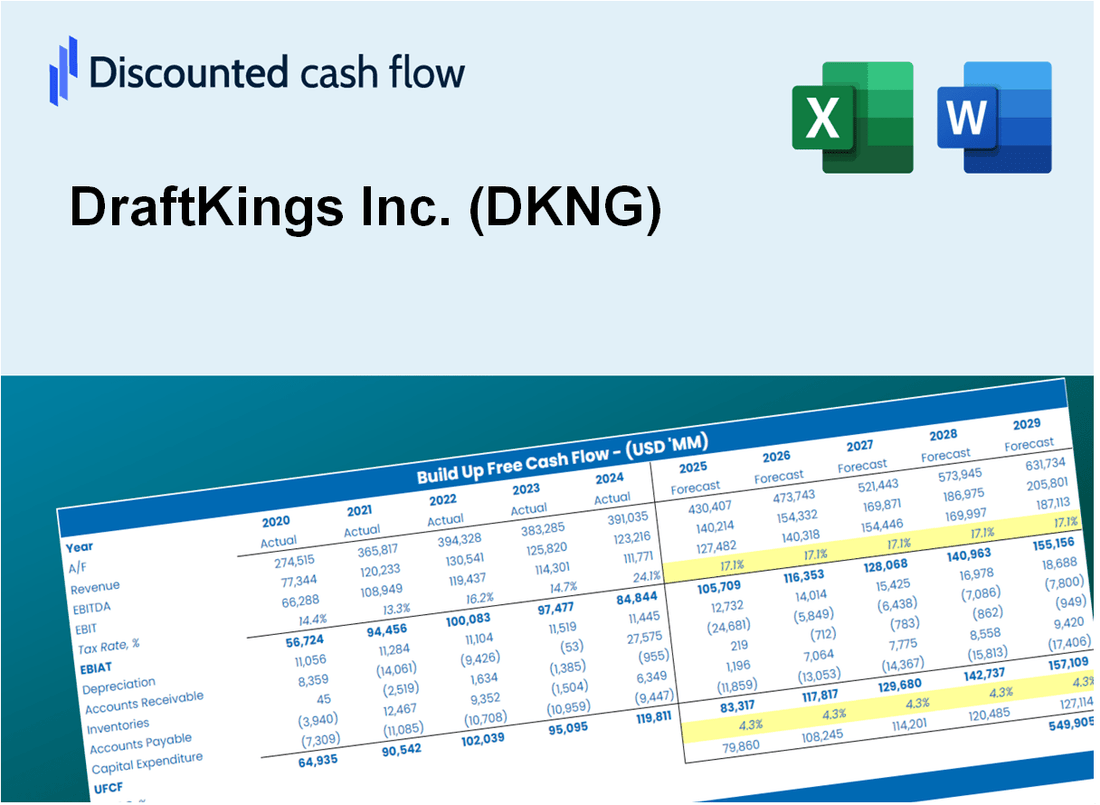
Discounted Cash Flow (DCF) - (USD MM)
| Year | AY1 2020 |
AY2 2021 |
AY3 2022 |
AY4 2023 |
AY5 2024 |
FY1 2025 |
FY2 2026 |
FY3 2027 |
FY4 2028 |
FY5 2029 |
|---|---|---|---|---|---|---|---|---|---|---|
| Revenue | 614.5 | 1,296.0 | 2,240.5 | 3,665.4 | 4,767.7 | 7,944.7 | 13,238.8 | 22,060.6 | 36,761.0 | 61,257.1 |
| Revenue Growth, % | 0 | 110.9 | 72.87 | 63.6 | 30.07 | 66.64 | 66.64 | 66.64 | 66.64 | 66.64 |
| EBITDA | -765.8 | -1,394.4 | -1,271.1 | -586.7 | -319.3 | -4,440.1 | -7,398.8 | -12,329.0 | -20,544.6 | -34,234.8 |
| EBITDA, % | -124.62 | -107.59 | -56.73 | -16.01 | -6.7 | -55.89 | -55.89 | -55.89 | -55.89 | -55.89 |
| Depreciation | 77.4 | 121.1 | 169.3 | 201.9 | 270.9 | 646.5 | 1,077.3 | 1,795.2 | 2,991.4 | 4,984.8 |
| Depreciation, % | 12.6 | 9.35 | 7.55 | 5.51 | 5.68 | 8.14 | 8.14 | 8.14 | 8.14 | 8.14 |
| EBIT | -843.3 | -1,515.5 | -1,440.3 | -788.6 | -590.2 | -4,737.9 | -7,895.1 | -13,156.0 | -21,922.7 | -36,531.2 |
| EBIT, % | -137.22 | -116.94 | -64.29 | -21.51 | -12.38 | -59.64 | -59.64 | -59.64 | -59.64 | -59.64 |
| Total Cash | 1,817.3 | 2,152.9 | 1,309.2 | 1,270.5 | 788.3 | 4,919.8 | 8,198.2 | 13,661.2 | 22,764.5 | 37,934.0 |
| Total Cash, percent | .0 | .0 | .0 | .0 | .0 | .0 | .0 | .0 | .0 | .0 |
| Account Receivables | 74.8 | 97.8 | 211.2 | 349.3 | 120.4 | 654.6 | 1,090.7 | 1,817.6 | 3,028.7 | 5,047.0 |
| Account Receivables, % | 12.17 | 7.55 | 9.43 | 9.53 | 2.52 | 8.24 | 8.24 | 8.24 | 8.24 | 8.24 |
| Inventories | .0 | .0 | .0 | .0 | .0 | .0 | .0 | .0 | .0 | .0 |
| Inventories, % | 0 | 0 | 0 | 0 | 0 | 0 | 0 | 0 | 0 | 0 |
| Accounts Payable | 28.1 | 52.5 | 10.1 | 34.1 | 53.7 | 176.9 | 294.7 | 491.2 | 818.4 | 1,363.8 |
| Accounts Payable, % | 4.57 | 4.05 | 0.45294 | 0.93106 | 1.13 | 2.23 | 2.23 | 2.23 | 2.23 | 2.23 |
| Capital Expenditure | -47.7 | -98.3 | -103.6 | -113.4 | -10.2 | -369.9 | -616.3 | -1,027.0 | -1,711.4 | -2,851.8 |
| Capital Expenditure, % | -7.76 | -7.58 | -4.63 | -3.09 | -0.21344 | -4.66 | -4.66 | -4.66 | -4.66 | -4.66 |
| Tax Rate, % | 14.54 | 14.54 | 14.54 | 14.54 | 14.54 | 14.54 | 14.54 | 14.54 | 14.54 | 14.54 |
| EBITAT | -842.8 | -1,523.8 | -1,372.7 | -798.7 | -504.4 | -4,555.1 | -7,590.5 | -12,648.5 | -21,077.0 | -35,121.9 |
| Depreciation | ||||||||||
| Changes in Account Receivables | ||||||||||
| Changes in Inventories | ||||||||||
| Changes in Accounts Payable | ||||||||||
| Capital Expenditure | ||||||||||
| UFCF | -859.8 | -1,499.5 | -1,462.9 | -824.3 | 4.8 | -4,689.4 | -7,447.8 | -12,410.7 | -20,680.8 | -34,461.7 |
| WACC, % | 10.68 | 10.68 | 10.67 | 10.68 | 10.64 | 10.67 | 10.67 | 10.67 | 10.67 | 10.67 |
| PV UFCF | ||||||||||
| SUM PV UFCF | -54,015.3 | |||||||||
| Long Term Growth Rate, % | 2.00 | |||||||||
| Free cash flow (T + 1) | -35,151 | |||||||||
| Terminal Value | -405,347 | |||||||||
| Present Terminal Value | -244,142 | |||||||||
| Enterprise Value | -298,157 | |||||||||
| Net Debt | 547 | |||||||||
| Equity Value | -298,704 | |||||||||
| Diluted Shares Outstanding, MM | 482 | |||||||||
| Equity Value Per Share | -619.78 |
What You Will Get
- Real DKNG Financials: Access to historical and projected data for precise valuation.
- Customizable Inputs: Adjust metrics like WACC, tax rates, revenue growth, and capital expenditures.
- Dynamic Calculations: Intrinsic value and NPV are computed automatically.
- Scenario Analysis: Evaluate various scenarios to assess DraftKings’ future performance.
- User-Friendly Design: Crafted for professionals while being easy for newcomers to navigate.
Key Features
- Pre-Loaded Data: DraftKings Inc.'s historical financial statements and pre-filled forecasts.
- Fully Adjustable Inputs: Modify WACC, tax rates, revenue growth, and EBITDA margins as needed.
- Instant Results: Observe DraftKings' intrinsic value recalculating in real time.
- Clear Visual Outputs: Dashboard charts present valuation results and essential metrics.
- Built for Accuracy: A professional tool designed for analysts, investors, and finance professionals.
How It Works
- Download: Obtain the ready-to-use Excel file featuring DraftKings Inc.'s (DKNG) financial data.
- Customize: Modify forecasts, such as revenue growth, EBITDA %, and WACC.
- Update Automatically: The intrinsic value and NPV calculations refresh in real-time.
- Test Scenarios: Generate various projections and compare results instantly.
- Make Decisions: Utilize the valuation outcomes to inform your investment strategy.
Why Choose DraftKings Inc. (DKNG)?
- Save Time: Get instant access to advanced betting tools without the hassle of setup.
- Enhance Accuracy: Utilize reliable data analytics to improve your betting strategies.
- Fully Customizable: Adjust your betting preferences and strategies to fit your unique style.
- Easy to Understand: Intuitive interface and visual analytics simplify complex betting information.
- Trusted by Professionals: Used by industry experts who prioritize accuracy and efficiency.
Who Should Use This Product?
- Investors: Accurately assess DraftKings Inc.’s (DKNG) fair value before making investment choices.
- CFOs: Utilize a professional-grade DCF model for financial analysis and reporting.
- Consultants: Easily customize the template for valuation reports tailored to clients.
- Entrepreneurs: Acquire insights into financial modeling practices utilized by leading companies.
- Educators: Employ it as a teaching resource to illustrate valuation techniques.
What the Template Contains
- Pre-Filled Data: Includes DraftKings Inc.'s (DKNG) historical financials and forecasts.
- Discounted Cash Flow Model: Editable DCF valuation model with automatic calculations.
- Weighted Average Cost of Capital (WACC): A dedicated sheet for calculating WACC based on custom inputs.
- Key Financial Ratios: Analyze DraftKings Inc.'s (DKNG) profitability, efficiency, and leverage.
- Customizable Inputs: Edit revenue growth, margins, and tax rates with ease.
- Clear Dashboard: Charts and tables summarizing key valuation results.
Disclaimer
All information, articles, and product details provided on this website are for general informational and educational purposes only. We do not claim any ownership over, nor do we intend to infringe upon, any trademarks, copyrights, logos, brand names, or other intellectual property mentioned or depicted on this site. Such intellectual property remains the property of its respective owners, and any references here are made solely for identification or informational purposes, without implying any affiliation, endorsement, or partnership.
We make no representations or warranties, express or implied, regarding the accuracy, completeness, or suitability of any content or products presented. Nothing on this website should be construed as legal, tax, investment, financial, medical, or other professional advice. In addition, no part of this site—including articles or product references—constitutes a solicitation, recommendation, endorsement, advertisement, or offer to buy or sell any securities, franchises, or other financial instruments, particularly in jurisdictions where such activity would be unlawful.
All content is of a general nature and may not address the specific circumstances of any individual or entity. It is not a substitute for professional advice or services. Any actions you take based on the information provided here are strictly at your own risk. You accept full responsibility for any decisions or outcomes arising from your use of this website and agree to release us from any liability in connection with your use of, or reliance upon, the content or products found herein.