
|
شركة Dorman Products، Inc. (DORM) تقييم DCF |
Fully Editable: Tailor To Your Needs In Excel Or Sheets
Professional Design: Trusted, Industry-Standard Templates
Investor-Approved Valuation Models
MAC/PC Compatible, Fully Unlocked
No Expertise Is Needed; Easy To Follow
Dorman Products, Inc. (DORM) Bundle
هل تتطلع إلى تحديد القيمة الجوهرية لمنتجات Dorman ، Inc.؟ تدمج حاسبة Dorm DCF الخاصة بنا بيانات العالم الحقيقي بميزات تخصيص شاملة ، مما يتيح لك تحسين التوقعات وتعزيز خيارات الاستثمار الخاصة بك.
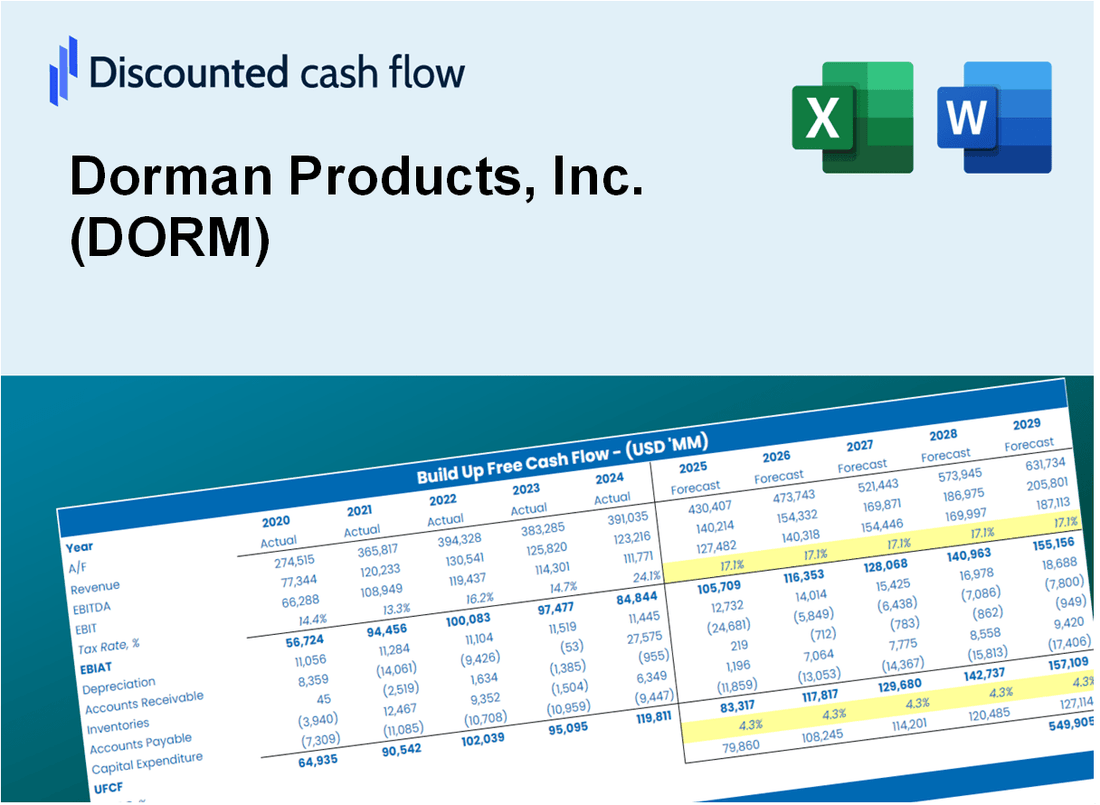
Discounted Cash Flow (DCF) - (USD MM)
| Year | AY1 2020 |
AY2 2021 |
AY3 2022 |
AY4 2023 |
AY5 2024 |
FY1 2025 |
FY2 2026 |
FY3 2027 |
FY4 2028 |
FY5 2029 |
|---|---|---|---|---|---|---|---|---|---|---|
| Revenue | 1,092.7 | 1,345.2 | 1,733.7 | 1,929.8 | 2,009.2 | 2,347.8 | 2,743.4 | 3,205.8 | 3,746.0 | 4,377.3 |
| Revenue Growth, % | 0 | 23.11 | 28.88 | 11.31 | 4.11 | 16.85 | 16.85 | 16.85 | 16.85 | 16.85 |
| EBITDA | 168.6 | 207.1 | 216.5 | 271.3 | 352.7 | 351.8 | 411.1 | 480.4 | 561.3 | 655.9 |
| EBITDA, % | 15.43 | 15.4 | 12.49 | 14.06 | 17.55 | 14.99 | 14.99 | 14.99 | 14.99 | 14.99 |
| Depreciation | 32.3 | 35.2 | 44.7 | 54.7 | 56.7 | 64.8 | 75.8 | 88.5 | 103.4 | 120.9 |
| Depreciation, % | 2.96 | 2.62 | 2.58 | 2.84 | 2.82 | 2.76 | 2.76 | 2.76 | 2.76 | 2.76 |
| EBIT | 136.3 | 171.9 | 171.8 | 216.6 | 296.0 | 287.0 | 335.3 | 391.9 | 457.9 | 535.1 |
| EBIT, % | 12.48 | 12.78 | 9.91 | 11.22 | 14.73 | 12.22 | 12.22 | 12.22 | 12.22 | 12.22 |
| Total Cash | 155.6 | 58.8 | 46.0 | 36.8 | 57.1 | 122.1 | 142.7 | 166.8 | 194.9 | 227.7 |
| Total Cash, percent | .0 | .0 | .0 | .0 | .0 | .0 | .0 | .0 | .0 | .0 |
| Account Receivables | 460.9 | 472.8 | 427.4 | 526.9 | 573.8 | 741.1 | 866.0 | 1,011.9 | 1,182.5 | 1,381.7 |
| Account Receivables, % | 42.18 | 35.14 | 24.65 | 27.3 | 28.56 | 31.57 | 31.57 | 31.57 | 31.57 | 31.57 |
| Inventories | 298.7 | 532.0 | 755.9 | 637.4 | 708.0 | 839.3 | 980.8 | 1,146.0 | 1,339.2 | 1,564.9 |
| Inventories, % | 27.34 | 39.55 | 43.6 | 33.03 | 35.24 | 35.75 | 35.75 | 35.75 | 35.75 | 35.75 |
| Accounts Payable | 117.9 | 177.4 | 179.8 | 176.7 | 231.8 | 258.4 | 302.0 | 352.9 | 412.3 | 481.8 |
| Accounts Payable, % | 10.79 | 13.19 | 10.37 | 9.15 | 11.54 | 11.01 | 11.01 | 11.01 | 11.01 | 11.01 |
| Capital Expenditure | -15.5 | -19.8 | -37.9 | -44.0 | -39.4 | -43.7 | -51.1 | -59.7 | -69.8 | -81.5 |
| Capital Expenditure, % | -1.41 | -1.47 | -2.19 | -2.28 | -1.96 | -1.86 | -1.86 | -1.86 | -1.86 | -1.86 |
| Tax Rate, % | 25.85 | 25.85 | 25.85 | 25.85 | 25.85 | 25.85 | 25.85 | 25.85 | 25.85 | 25.85 |
| EBITAT | 107.3 | 133.2 | 133.7 | 166.1 | 219.5 | 220.9 | 258.1 | 301.6 | 352.5 | 411.9 |
| Depreciation | ||||||||||
| Changes in Account Receivables | ||||||||||
| Changes in Inventories | ||||||||||
| Changes in Accounts Payable | ||||||||||
| Capital Expenditure | ||||||||||
| UFCF | -517.5 | -37.1 | -35.6 | 192.8 | 174.4 | -30.0 | 60.0 | 70.1 | 81.9 | 95.8 |
| WACC, % | 7.6 | 7.59 | 7.59 | 7.58 | 7.56 | 7.58 | 7.58 | 7.58 | 7.58 | 7.58 |
| PV UFCF | ||||||||||
| SUM PV UFCF | 207.9 | |||||||||
| Long Term Growth Rate, % | 2.00 | |||||||||
| Free cash flow (T + 1) | 98 | |||||||||
| Terminal Value | 1,749 | |||||||||
| Present Terminal Value | 1,214 | |||||||||
| Enterprise Value | 1,422 | |||||||||
| Net Debt | 516 | |||||||||
| Equity Value | 906 | |||||||||
| Diluted Shares Outstanding, MM | 31 | |||||||||
| Equity Value Per Share | 29.27 |
What You Will Get
- Editable Forecast Inputs: Easily modify key assumptions (growth %, margins, WACC) to generate various scenarios.
- Real-World Data: Dorman Products, Inc.'s (DORM) financial data pre-filled to kickstart your analysis.
- Automatic DCF Outputs: The template computes Net Present Value (NPV) and intrinsic value for your convenience.
- Customizable and Professional: A sleek Excel model that adjusts to your valuation requirements.
- Built for Analysts and Investors: Perfect for evaluating projections, confirming strategies, and enhancing efficiency.
Key Features
- Real-Life DORM Data: Pre-filled with Dorman Products' historical financials and future projections.
- Fully Customizable Inputs: Modify revenue growth, profit margins, WACC, tax rates, and capital expenditures.
- Dynamic Valuation Model: Instant updates to Net Present Value (NPV) and intrinsic value based on your adjustments.
- Scenario Testing: Develop various forecast scenarios to explore different valuation results.
- User-Friendly Design: Intuitive, organized, and tailored for both professionals and newcomers.
How It Works
- Download: Get the pre-prepared Excel file featuring Dorman Products, Inc.'s (DORM) financial data.
- Customize: Tailor your forecasts, including sales growth, EBITDA margin, and WACC.
- Update Automatically: The intrinsic value and NPV calculations refresh in real-time.
- Test Scenarios: Develop various projections and instantly compare results.
- Make Decisions: Leverage the valuation outcomes to inform your investment approach.
Why Choose This Calculator?
- User-Friendly Interface: Perfect for both novices and seasoned professionals.
- Customizable Inputs: Adjust parameters to fit your specific analysis needs.
- Real-Time Feedback: Instantly view changes to Dorman Products, Inc.'s valuation as you modify inputs.
- Preloaded Data: Comes equipped with Dorman Products, Inc.'s actual financials for swift evaluations.
- Relied Upon by Experts: Favored by investors and analysts for making well-informed decisions.
Who Should Use Dorman Products, Inc. (DORM)?
- Automotive Repair Professionals: Enhance service offerings with high-quality aftermarket parts.
- Retailers: Stock a diverse range of products to meet customer demands efficiently.
- Fleet Managers: Ensure vehicle reliability with durable and cost-effective solutions.
- DIY Enthusiasts: Access a wide selection of parts to tackle any repair project with confidence.
- Educators and Students: Use Dorman's resources to learn about automotive parts and industry practices.
What the Template Contains
- Pre-Filled Data: Includes Dorman Products' historical financials and forecasts.
- Discounted Cash Flow Model: Editable DCF valuation model with automatic calculations.
- Weighted Average Cost of Capital (WACC): A dedicated sheet for calculating WACC based on custom inputs.
- Key Financial Ratios: Analyze Dorman Products' profitability, efficiency, and leverage.
- Customizable Inputs: Edit revenue growth, margins, and tax rates with ease.
- Clear Dashboard: Charts and tables summarizing key valuation results.
Disclaimer
All information, articles, and product details provided on this website are for general informational and educational purposes only. We do not claim any ownership over, nor do we intend to infringe upon, any trademarks, copyrights, logos, brand names, or other intellectual property mentioned or depicted on this site. Such intellectual property remains the property of its respective owners, and any references here are made solely for identification or informational purposes, without implying any affiliation, endorsement, or partnership.
We make no representations or warranties, express or implied, regarding the accuracy, completeness, or suitability of any content or products presented. Nothing on this website should be construed as legal, tax, investment, financial, medical, or other professional advice. In addition, no part of this site—including articles or product references—constitutes a solicitation, recommendation, endorsement, advertisement, or offer to buy or sell any securities, franchises, or other financial instruments, particularly in jurisdictions where such activity would be unlawful.
All content is of a general nature and may not address the specific circumstances of any individual or entity. It is not a substitute for professional advice or services. Any actions you take based on the information provided here are strictly at your own risk. You accept full responsibility for any decisions or outcomes arising from your use of this website and agree to release us from any liability in connection with your use of, or reliance upon, the content or products found herein.