
|
Dow Inc. (DOW) تقييم DCF |
Fully Editable: Tailor To Your Needs In Excel Or Sheets
Professional Design: Trusted, Industry-Standard Templates
Investor-Approved Valuation Models
MAC/PC Compatible, Fully Unlocked
No Expertise Is Needed; Easy To Follow
Dow Inc. (DOW) Bundle
استكشف شركة Dow Inc. (DOW) التوقعات المالية باستخدام حاسبة DCF سهلة الاستخدام! أدخل توقعاتك للنمو والهوامش والنفقات لحساب Dow Inc. (DOW) القيمة الجوهرية وإبلاغ قرارات الاستثمار الخاصة بك.
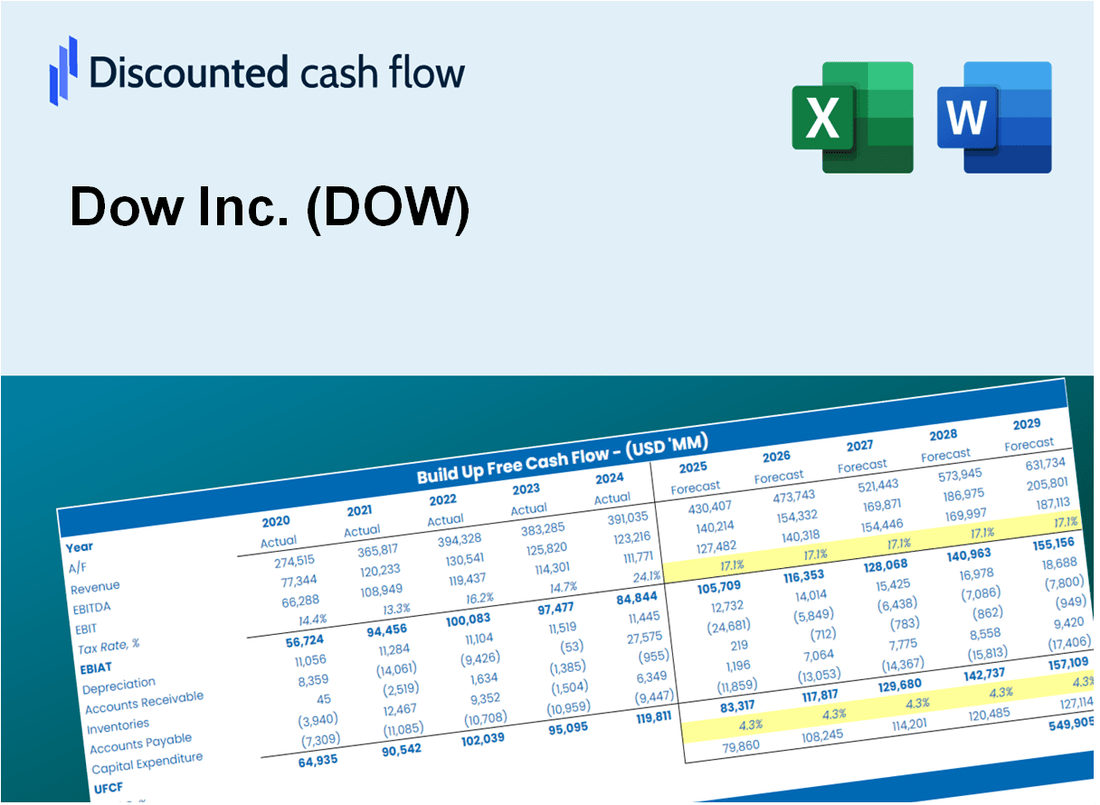
Discounted Cash Flow (DCF) - (USD MM)
| Year | AY1 2020 |
AY2 2021 |
AY3 2022 |
AY4 2023 |
AY5 2024 |
FY1 2025 |
FY2 2026 |
FY3 2027 |
FY4 2028 |
FY5 2029 |
|---|---|---|---|---|---|---|---|---|---|---|
| Revenue | 38,542.0 | 54,968.0 | 56,902.0 | 44,622.0 | 42,964.0 | 45,202.4 | 47,557.5 | 50,035.3 | 52,642.2 | 55,384.9 |
| Revenue Growth, % | 0 | 42.62 | 3.52 | -21.58 | -3.72 | 5.21 | 5.21 | 5.21 | 5.21 | 5.21 |
| EBITDA | 5,538.0 | 11,676.0 | 9,499.0 | 4,003.0 | 5,252.0 | 6,644.7 | 6,990.9 | 7,355.1 | 7,738.3 | 8,141.5 |
| EBITDA, % | 14.37 | 21.24 | 16.69 | 8.97 | 12.22 | 14.7 | 14.7 | 14.7 | 14.7 | 14.7 |
| Depreciation | 2,589.0 | 2,842.0 | 2,758.0 | 2,611.0 | 2,894.0 | 2,650.8 | 2,788.9 | 2,934.3 | 3,087.1 | 3,248.0 |
| Depreciation, % | 6.72 | 5.17 | 4.85 | 5.85 | 6.74 | 5.86 | 5.86 | 5.86 | 5.86 | 5.86 |
| EBIT | 2,949.0 | 8,834.0 | 6,741.0 | 1,392.0 | 2,358.0 | 3,993.8 | 4,201.9 | 4,420.8 | 4,651.2 | 4,893.5 |
| EBIT, % | 7.65 | 16.07 | 11.85 | 3.12 | 5.49 | 8.84 | 8.84 | 8.84 | 8.84 | 8.84 |
| Total Cash | 5,104.0 | 2,988.0 | 3,886.0 | 2,987.0 | 2,572.0 | 3,452.4 | 3,632.3 | 3,821.5 | 4,020.6 | 4,230.1 |
| Total Cash, percent | .0 | .0 | .0 | .0 | .0 | .0 | .0 | .0 | .0 | .0 |
| Account Receivables | 7,390.0 | 9,554.0 | 7,755.0 | 6,614.0 | 6,864.0 | 7,321.2 | 7,702.6 | 8,103.9 | 8,526.1 | 8,970.4 |
| Account Receivables, % | 19.17 | 17.38 | 13.63 | 14.82 | 15.98 | 16.2 | 16.2 | 16.2 | 16.2 | 16.2 |
| Inventories | 5,701.0 | 7,372.0 | 6,988.0 | 6,076.0 | 6,544.0 | 6,267.9 | 6,594.5 | 6,938.1 | 7,299.6 | 7,679.9 |
| Inventories, % | 14.79 | 13.41 | 12.28 | 13.62 | 15.23 | 13.87 | 13.87 | 13.87 | 13.87 | 13.87 |
| Accounts Payable | 3,763.0 | 5,577.0 | 4,940.0 | 4,529.0 | 4,847.0 | 4,522.2 | 4,757.9 | 5,005.7 | 5,266.5 | 5,540.9 |
| Accounts Payable, % | 9.76 | 10.15 | 8.68 | 10.15 | 11.28 | 10 | 10 | 10 | 10 | 10 |
| Capital Expenditure | -1,387.0 | -2,324.0 | -2,058.0 | -2,477.0 | -3,065.0 | -2,181.3 | -2,295.0 | -2,414.5 | -2,540.3 | -2,672.7 |
| Capital Expenditure, % | -3.6 | -4.23 | -3.62 | -5.55 | -7.13 | -4.83 | -4.83 | -4.83 | -4.83 | -4.83 |
| Tax Rate, % | 30.25 | 30.25 | 30.25 | 30.25 | 30.25 | 30.25 | 30.25 | 30.25 | 30.25 | 30.25 |
| EBITAT | 1,744.3 | 6,844.9 | 5,071.8 | 1,249.8 | 1,644.7 | 2,966.7 | 3,121.2 | 3,283.9 | 3,455.0 | 3,635.0 |
| Depreciation | ||||||||||
| Changes in Account Receivables | ||||||||||
| Changes in Inventories | ||||||||||
| Changes in Accounts Payable | ||||||||||
| Capital Expenditure | ||||||||||
| UFCF | -6,381.7 | 5,341.9 | 7,317.8 | 3,025.8 | 1,073.7 | 2,930.3 | 3,142.8 | 3,306.6 | 3,478.9 | 3,660.1 |
| WACC, % | 4.89 | 5.3 | 5.25 | 5.58 | 5.13 | 5.23 | 5.23 | 5.23 | 5.23 | 5.23 |
| PV UFCF | ||||||||||
| SUM PV UFCF | 14,135.3 | |||||||||
| Long Term Growth Rate, % | 2.00 | |||||||||
| Free cash flow (T + 1) | 3,733 | |||||||||
| Terminal Value | 115,674 | |||||||||
| Present Terminal Value | 89,658 | |||||||||
| Enterprise Value | 103,793 | |||||||||
| Net Debt | 15,456 | |||||||||
| Equity Value | 88,337 | |||||||||
| Diluted Shares Outstanding, MM | 705 | |||||||||
| Equity Value Per Share | 125.28 |
What You Will Get
- Editable Excel Template: A fully customizable Excel-based DCF Calculator featuring pre-filled real DOW financials.
- Real-World Data: Historical data and forward-looking estimates (as highlighted in the yellow cells).
- Forecast Flexibility: Adjust forecast assumptions such as revenue growth, EBITDA %, and WACC.
- Automatic Calculations: Instantly observe the effects of your inputs on Dow's valuation.
- Professional Tool: Designed for investors, CFOs, consultants, and financial analysts.
- User-Friendly Design: Organized for clarity and ease of use, complete with step-by-step instructions.
Key Features
- Comprehensive DCF Calculator: Features detailed unlevered and levered DCF valuation models tailored for Dow Inc. (DOW).
- WACC Calculator: Pre-designed Weighted Average Cost of Capital sheet with adjustable inputs specific to Dow Inc. (DOW).
- Customizable Forecast Assumptions: Adjust growth rates, capital expenditures, and discount rates according to Dow Inc. (DOW) projections.
- Integrated Financial Ratios: Evaluate profitability, leverage, and efficiency ratios relevant to Dow Inc. (DOW).
- Interactive Dashboard and Charts: Visual representations of key valuation metrics for straightforward analysis of Dow Inc. (DOW).
How It Works
- 1. Access the Template: Download and open the Excel file featuring Dow Inc.'s preloaded data.
- 2. Modify Assumptions: Adjust key inputs such as growth rates, WACC, and capital expenditures.
- 3. Instant Results: The DCF model automatically computes intrinsic value and NPV.
- 4. Explore Scenarios: Evaluate various forecasts to assess different valuation outcomes.
- 5. Present with Assurance: Deliver professional valuation insights to aid your decision-making.
Why Choose This Calculator?
- User-Friendly Interface: Tailored for both novices and seasoned professionals.
- Customizable Inputs: Adjust parameters easily to suit your financial analysis.
- Real-Time Feedback: Observe immediate updates to Dow Inc.'s valuation as you change inputs.
- Preloaded Data: Comes with Dow Inc.'s actual financial metrics for swift evaluations.
- Preferred by Experts: Utilized by investors and analysts for making well-informed choices.
Who Should Use This Product?
- Investors: Evaluate Dow Inc.'s valuation prior to making stock transactions.
- CFOs and Financial Analysts: Optimize valuation methodologies and assess financial forecasts.
- Startup Founders: Understand the valuation processes of leading public companies like Dow Inc.
- Consultants: Create comprehensive valuation reports for clients utilizing Dow Inc. data.
- Students and Educators: Apply real-world examples to learn and teach valuation strategies.
What the Template Contains
- Pre-Filled DCF Model: Dow Inc.'s (DOW) financial data preloaded for immediate use.
- WACC Calculator: Detailed calculations for Weighted Average Cost of Capital.
- Financial Ratios: Evaluate Dow Inc.'s (DOW) profitability, leverage, and efficiency.
- Editable Inputs: Change assumptions such as growth, margins, and CAPEX to fit your scenarios.
- Financial Statements: Annual and quarterly reports to support detailed analysis.
- Interactive Dashboard: Easily visualize key valuation metrics and results.
Disclaimer
All information, articles, and product details provided on this website are for general informational and educational purposes only. We do not claim any ownership over, nor do we intend to infringe upon, any trademarks, copyrights, logos, brand names, or other intellectual property mentioned or depicted on this site. Such intellectual property remains the property of its respective owners, and any references here are made solely for identification or informational purposes, without implying any affiliation, endorsement, or partnership.
We make no representations or warranties, express or implied, regarding the accuracy, completeness, or suitability of any content or products presented. Nothing on this website should be construed as legal, tax, investment, financial, medical, or other professional advice. In addition, no part of this site—including articles or product references—constitutes a solicitation, recommendation, endorsement, advertisement, or offer to buy or sell any securities, franchises, or other financial instruments, particularly in jurisdictions where such activity would be unlawful.
All content is of a general nature and may not address the specific circumstances of any individual or entity. It is not a substitute for professional advice or services. Any actions you take based on the information provided here are strictly at your own risk. You accept full responsibility for any decisions or outcomes arising from your use of this website and agree to release us from any liability in connection with your use of, or reliance upon, the content or products found herein.