
|
Solo Brands ، Inc. (DTC) تقييم DCF |
Fully Editable: Tailor To Your Needs In Excel Or Sheets
Professional Design: Trusted, Industry-Standard Templates
Investor-Approved Valuation Models
MAC/PC Compatible, Fully Unlocked
No Expertise Is Needed; Easy To Follow
Solo Brands, Inc. (DTC) Bundle
استكشف إمكانات مالية Solo Brands ، Inc. (DTC) مع حاسبة DCF سهلة الاستخدام! أدخل توقعاتك للنمو والهوامش والمصروفات لتحديد القيمة الجوهرية للعلامات الفردية ، Inc. (DTC) وصقل نهج الاستثمار الخاص بك.
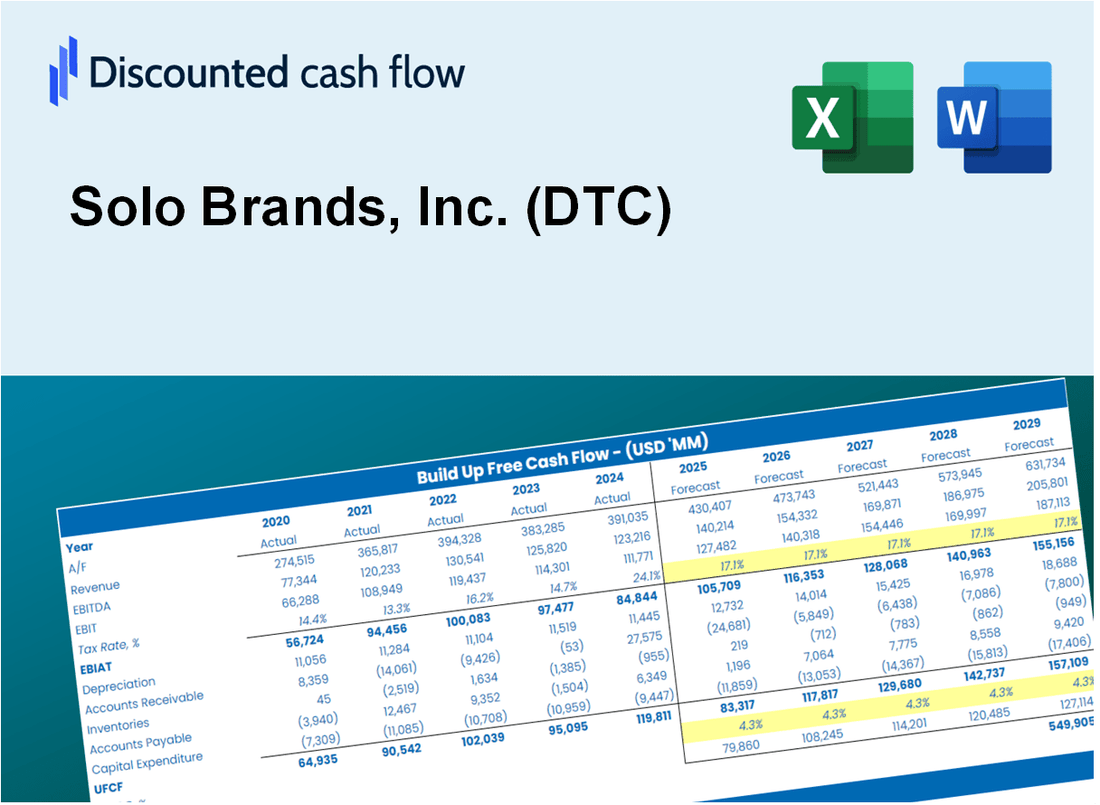
Discounted Cash Flow (DCF) - (USD MM)
| Year | AY1 2020 |
AY2 2021 |
AY3 2022 |
AY4 2023 |
AY5 2024 |
FY1 2025 |
FY2 2026 |
FY3 2027 |
FY4 2028 |
FY5 2029 |
|---|---|---|---|---|---|---|---|---|---|---|
| Revenue | 133.4 | 403.7 | 517.6 | 494.8 | 454.6 | 586.0 | 755.5 | 973.9 | 1,255.5 | 1,618.6 |
| Revenue Growth, % | 0 | 202.57 | 28.22 | -4.41 | -8.13 | 28.92 | 28.92 | 28.92 | 28.92 | 28.92 |
| EBITDA | -15.2 | 87.1 | 58.4 | 48.5 | -149.4 | -1.9 | -2.5 | -3.2 | -4.1 | -5.3 |
| EBITDA, % | -11.41 | 21.57 | 11.29 | 9.8 | -32.88 | -0.32584 | -0.32584 | -0.32584 | -0.32584 | -0.32584 |
| Depreciation | 5.7 | 18.2 | 24.6 | 27.3 | 25.7 | 28.9 | 37.3 | 48.1 | 62.0 | 80.0 |
| Depreciation, % | 4.25 | 4.52 | 4.75 | 5.53 | 5.65 | 4.94 | 4.94 | 4.94 | 4.94 | 4.94 |
| EBIT | -20.9 | 68.9 | 33.9 | 21.1 | -175.1 | -30.9 | -39.8 | -51.3 | -66.1 | -85.2 |
| EBIT, % | -15.66 | 17.06 | 6.54 | 4.27 | -38.53 | -5.27 | -5.27 | -5.27 | -5.27 | -5.27 |
| Total Cash | 32.8 | 25.1 | 23.3 | 19.8 | 12.0 | 49.1 | 63.3 | 81.6 | 105.2 | 135.7 |
| Total Cash, percent | .0 | .0 | .0 | .0 | .0 | .0 | .0 | .0 | .0 | .0 |
| Account Receivables | 4.2 | 21.5 | 26.2 | 53.5 | 39.4 | 38.7 | 49.8 | 64.3 | 82.8 | 106.8 |
| Account Receivables, % | 3.12 | 5.33 | 5.06 | 10.81 | 8.68 | 6.6 | 6.6 | 6.6 | 6.6 | 6.6 |
| Inventories | 14.3 | 102.3 | 133.0 | 116.6 | 108.6 | 128.0 | 165.1 | 212.8 | 274.3 | 353.6 |
| Inventories, % | 10.75 | 25.35 | 25.69 | 23.56 | 23.89 | 21.85 | 21.85 | 21.85 | 21.85 | 21.85 |
| Accounts Payable | 1.4 | 11.8 | 11.8 | 21.8 | 69.6 | 30.4 | 39.2 | 50.5 | 65.2 | 84.0 |
| Accounts Payable, % | 1.03 | 2.92 | 2.28 | 4.42 | 15.31 | 5.19 | 5.19 | 5.19 | 5.19 | 5.19 |
| Capital Expenditure | -1.0 | -10.6 | -9.2 | -9.1 | -14.5 | -11.9 | -15.4 | -19.8 | -25.5 | -32.9 |
| Capital Expenditure, % | -0.71799 | -2.64 | -1.79 | -1.84 | -3.19 | -2.03 | -2.03 | -2.03 | -2.03 | -2.03 |
| Tax Rate, % | 40.07 | 40.07 | 40.07 | 40.07 | 40.07 | 40.07 | 40.07 | 40.07 | 40.07 | 40.07 |
| EBITAT | -21.0 | 57.3 | 39.0 | 10.2 | -105.0 | -24.1 | -31.1 | -40.1 | -51.7 | -66.7 |
| Depreciation | ||||||||||
| Changes in Account Receivables | ||||||||||
| Changes in Inventories | ||||||||||
| Changes in Accounts Payable | ||||||||||
| Capital Expenditure | ||||||||||
| UFCF | -33.4 | -30.1 | 19.0 | 27.6 | -24.0 | -65.0 | -48.6 | -62.6 | -80.7 | -104.1 |
| WACC, % | 39.1 | 33.2 | 39.1 | 20.94 | 25.08 | 31.48 | 31.48 | 31.48 | 31.48 | 31.48 |
| PV UFCF | ||||||||||
| SUM PV UFCF | -158.6 | |||||||||
| Long Term Growth Rate, % | 4.00 | |||||||||
| Free cash flow (T + 1) | -108 | |||||||||
| Terminal Value | -394 | |||||||||
| Present Terminal Value | -100 | |||||||||
| Enterprise Value | -259 | |||||||||
| Net Debt | 19 | |||||||||
| Equity Value | -278 | |||||||||
| Diluted Shares Outstanding, MM | 58 | |||||||||
| Equity Value Per Share | -4.75 |
What You Will Receive
- Genuine DTC Financial Data: Pre-loaded with Solo Brands’ historical and forecasted data for accurate analysis.
- Completely Customizable Template: Easily adjust key inputs such as revenue growth, WACC, and EBITDA %.
- Instant Calculations: Watch Solo Brands’ intrinsic value refresh automatically based on your modifications.
- Expert Valuation Tool: Tailored for investors, analysts, and consultants aiming for precise DCF outcomes.
- Intuitive Design: Straightforward layout and clear guidelines suitable for all skill levels.
Key Features
- Genuine Solo Brands Financials: Gain access to precise pre-loaded historical data and future forecasts.
- Adjustable Forecast Parameters: Modify yellow-highlighted cells such as WACC, growth rates, and profit margins.
- Real-time Calculations: Automatic updates for DCF, Net Present Value (NPV), and cash flow assessments.
- Interactive Dashboard: User-friendly charts and summaries to help visualize your valuation outcomes.
- Designed for All Skill Levels: A straightforward, intuitive layout tailored for investors, CFOs, and consultants alike.
How It Works
- Step 1: Download the Excel file for Solo Brands, Inc. (DTC) [DTC].
- Step 2: Review Solo Brands' pre-filled financial data and forecasts.
- Step 3: Modify key inputs such as revenue growth, WACC, and tax rates (highlighted cells).
- Step 4: Observe the DCF model update in real-time as you adjust your assumptions.
- Step 5: Analyze the outputs and leverage the results for your investment decisions.
Why Choose This Calculator for Solo Brands, Inc. (DTC)?
- User-Friendly Interface: Perfectly crafted for both novices and seasoned users.
- Customizable Inputs: Easily adjust parameters to suit your financial analysis needs.
- Real-Time Feedback: Instantly observe changes in Solo Brands’ valuation as you modify inputs.
- Pre-Loaded Data: Comes equipped with Solo Brands’ actual financial metrics for swift evaluations.
- Relied Upon by Experts: A favorite tool among investors and analysts for making strategic decisions.
Who Should Use This Product?
- Retail Investors: Create comprehensive and accurate valuation models for Solo Brands, Inc. (DTC).
- Corporate Strategy Teams: Evaluate valuation scenarios to inform business strategy and decision-making.
- Financial Consultants: Offer clients precise valuation assessments for Solo Brands, Inc. (DTC).
- Students and Instructors: Utilize real market data to enhance learning and practice in financial modeling.
- Outdoor Enthusiasts: Gain insights into how companies like Solo Brands, Inc. (DTC) are valued within the outdoor retail sector.
What the Template Contains
- Pre-Filled Data: Includes Solo Brands, Inc.'s (DTC) historical financials and projections.
- Discounted Cash Flow Model: Editable DCF valuation model featuring automatic calculations.
- Weighted Average Cost of Capital (WACC): A dedicated sheet for calculating WACC based on tailored inputs.
- Key Financial Ratios: Evaluate Solo Brands, Inc.'s (DTC) profitability, efficiency, and leverage metrics.
- Customizable Inputs: Easily modify revenue growth, margins, and tax rates.
- Clear Dashboard: Visuals and tables summarizing essential valuation outcomes.
Disclaimer
All information, articles, and product details provided on this website are for general informational and educational purposes only. We do not claim any ownership over, nor do we intend to infringe upon, any trademarks, copyrights, logos, brand names, or other intellectual property mentioned or depicted on this site. Such intellectual property remains the property of its respective owners, and any references here are made solely for identification or informational purposes, without implying any affiliation, endorsement, or partnership.
We make no representations or warranties, express or implied, regarding the accuracy, completeness, or suitability of any content or products presented. Nothing on this website should be construed as legal, tax, investment, financial, medical, or other professional advice. In addition, no part of this site—including articles or product references—constitutes a solicitation, recommendation, endorsement, advertisement, or offer to buy or sell any securities, franchises, or other financial instruments, particularly in jurisdictions where such activity would be unlawful.
All content is of a general nature and may not address the specific circumstances of any individual or entity. It is not a substitute for professional advice or services. Any actions you take based on the information provided here are strictly at your own risk. You accept full responsibility for any decisions or outcomes arising from your use of this website and agree to release us from any liability in connection with your use of, or reliance upon, the content or products found herein.