
|
تقييم DCF لشركة DTE للطاقة (DTE) |
Fully Editable: Tailor To Your Needs In Excel Or Sheets
Professional Design: Trusted, Industry-Standard Templates
Investor-Approved Valuation Models
MAC/PC Compatible, Fully Unlocked
No Expertise Is Needed; Easy To Follow
DTE Energy Company (DTE) Bundle
استكشف المستقبل المالي لشركة DTE Energy مع حاسبة DCF سهلة الاستخدام! أدخل افتراضاتك للنمو والهوامش والتكاليف لحساب القيمة الجوهرية لـ DTE وتحسين استراتيجية الاستثمار الخاصة بك.
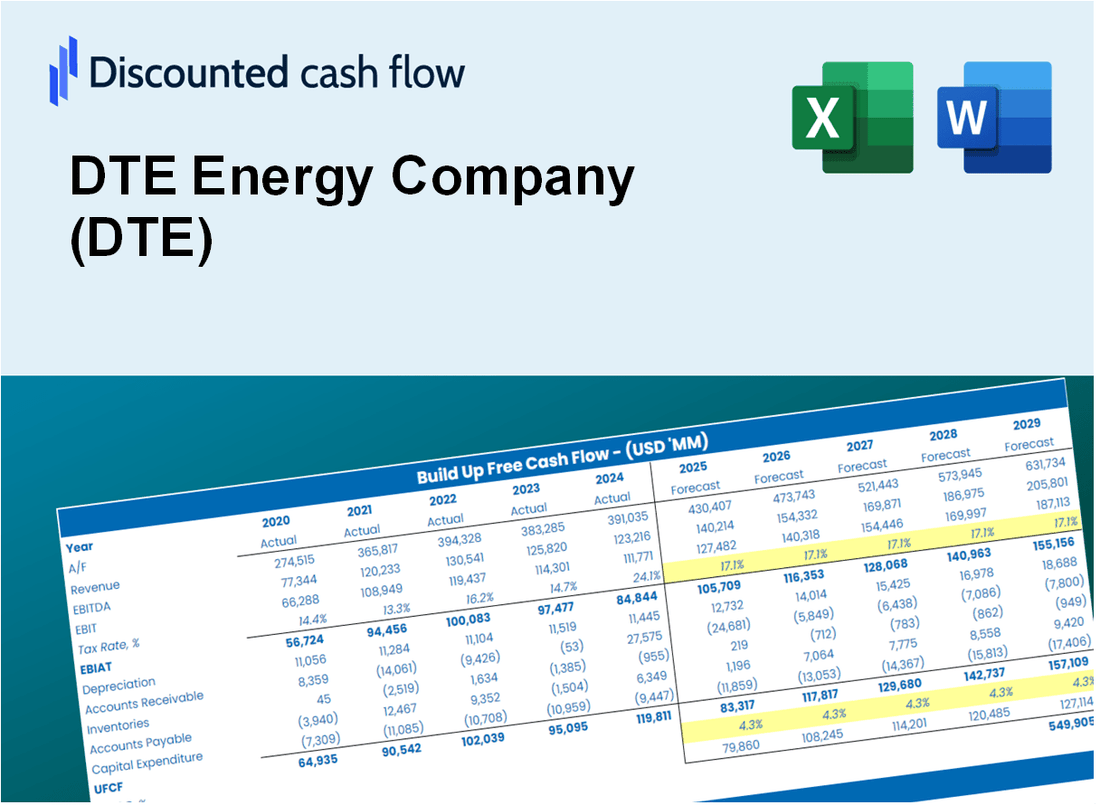
Discounted Cash Flow (DCF) - (USD MM)
| Year | AY1 2020 |
AY2 2021 |
AY3 2022 |
AY4 2023 |
AY5 2024 |
FY1 2025 |
FY2 2026 |
FY3 2027 |
FY4 2028 |
FY5 2029 |
|---|---|---|---|---|---|---|---|---|---|---|
| Revenue | 11,423.0 | 14,964.0 | 19,228.0 | 12,745.0 | 12,457.0 | 13,189.4 | 13,964.9 | 14,785.9 | 15,655.2 | 16,575.7 |
| Revenue Growth, % | 0 | 31 | 28.5 | -33.72 | -2.26 | 5.88 | 5.88 | 5.88 | 5.88 | 5.88 |
| EBITDA | 3,126.0 | 2,745.0 | 3,255.0 | 3,963.0 | 4,053.0 | 3,330.8 | 3,526.7 | 3,734.0 | 3,953.5 | 4,186.0 |
| EBITDA, % | 27.37 | 18.34 | 16.93 | 31.09 | 32.54 | 25.25 | 25.25 | 25.25 | 25.25 | 25.25 |
| Depreciation | 1,443.0 | 1,459.0 | 1,468.0 | 1,606.0 | 1,732.0 | 1,491.0 | 1,578.6 | 1,671.5 | 1,769.7 | 1,873.8 |
| Depreciation, % | 12.63 | 9.75 | 7.63 | 12.6 | 13.9 | 11.3 | 11.3 | 11.3 | 11.3 | 11.3 |
| EBIT | 1,683.0 | 1,286.0 | 1,787.0 | 2,357.0 | 2,321.0 | 1,839.8 | 1,948.0 | 2,062.5 | 2,183.8 | 2,312.2 |
| EBIT, % | 14.73 | 8.59 | 9.29 | 18.49 | 18.63 | 13.95 | 13.95 | 13.95 | 13.95 | 13.95 |
| Total Cash | 472.0 | 28.0 | 33.0 | 26.0 | 24.0 | 128.9 | 136.5 | 144.5 | 153.0 | 162.0 |
| Total Cash, percent | .0 | .0 | .0 | .0 | .0 | .0 | .0 | .0 | .0 | .0 |
| Account Receivables | 1,669.0 | 1,830.0 | 2,182.0 | 1,787.0 | 1,827.0 | 1,764.1 | 1,867.8 | 1,977.6 | 2,093.9 | 2,217.0 |
| Account Receivables, % | 14.61 | 12.23 | 11.35 | 14.02 | 14.67 | 13.38 | 13.38 | 13.38 | 13.38 | 13.38 |
| Inventories | 708.0 | 858.0 | 942.0 | 1,054.0 | 1,245.0 | 925.8 | 980.2 | 1,037.8 | 1,098.8 | 1,163.5 |
| Inventories, % | 6.2 | 5.73 | 4.9 | 8.27 | 9.99 | 7.02 | 7.02 | 7.02 | 7.02 | 7.02 |
| Accounts Payable | 1,000.0 | 1,414.0 | 1,604.0 | 1,361.0 | 1,387.0 | 1,275.6 | 1,350.6 | 1,430.1 | 1,514.1 | 1,603.2 |
| Accounts Payable, % | 8.75 | 9.45 | 8.34 | 10.68 | 11.13 | 9.67 | 9.67 | 9.67 | 9.67 | 9.67 |
| Capital Expenditure | -3,857.0 | -3,772.0 | -3,378.0 | -3,934.0 | -4,467.0 | -3,779.2 | -4,001.4 | -4,236.7 | -4,485.8 | -4,749.5 |
| Capital Expenditure, % | -33.77 | -25.21 | -17.57 | -30.87 | -35.86 | -28.65 | -28.65 | -28.65 | -28.65 | -28.65 |
| Tax Rate, % | -2.48 | -2.48 | -2.48 | -2.48 | -2.48 | -2.48 | -2.48 | -2.48 | -2.48 | -2.48 |
| EBITAT | 2,127.9 | 1,778.1 | 1,740.4 | 2,102.6 | 2,378.6 | 1,790.5 | 1,895.8 | 2,007.3 | 2,125.3 | 2,250.2 |
| Depreciation | ||||||||||
| Changes in Account Receivables | ||||||||||
| Changes in Inventories | ||||||||||
| Changes in Accounts Payable | ||||||||||
| Capital Expenditure | ||||||||||
| UFCF | -1,663.1 | -431.9 | -415.6 | -185.4 | -561.4 | -226.9 | -610.1 | -646.0 | -684.0 | -724.2 |
| WACC, % | 5.11 | 5.11 | 5.06 | 4.91 | 5.11 | 5.06 | 5.06 | 5.06 | 5.06 | 5.06 |
| PV UFCF | ||||||||||
| SUM PV UFCF | -2,452.7 | |||||||||
| Long Term Growth Rate, % | 2.00 | |||||||||
| Free cash flow (T + 1) | -739 | |||||||||
| Terminal Value | -24,111 | |||||||||
| Present Terminal Value | -18,835 | |||||||||
| Enterprise Value | -21,288 | |||||||||
| Net Debt | 23,217 | |||||||||
| Equity Value | -44,505 | |||||||||
| Diluted Shares Outstanding, MM | 207 | |||||||||
| Equity Value Per Share | -215.00 |
What You Will Receive
- Pre-Filled Financial Model: DTE Energy's actual data allows for accurate DCF valuation.
- Comprehensive Forecast Control: Modify revenue growth, margins, WACC, and other essential factors.
- Instantaneous Calculations: Real-time updates ensure you view results as adjustments are made.
- Investor-Ready Template: A polished Excel file crafted for high-quality valuation.
- Customizable and Reusable: Designed for adaptability, enabling repeated use for in-depth forecasts.
Key Features
- Comprehensive Financial Data: Access reliable pre-loaded historical performance metrics and future forecasts for DTE Energy Company (DTE).
- Adjustable Forecast Parameters: Modify highlighted cells to customize assumptions like discount rates, growth projections, and profit margins.
- Automated Calculations: Instant updates to DCF, Net Present Value (NPV), and cash flow assessments.
- User-Friendly Dashboard: Clear and concise charts and summaries to help you interpret your valuation findings.
- Designed for All Skill Levels: An intuitive layout suited for investors, financial officers, and consultants alike.
How It Works
- Step 1: Download the prebuilt Excel template featuring DTE Energy Company's (DTE) data.
- Step 2: Review the pre-filled sheets to familiarize yourself with the essential metrics.
- Step 3: Modify forecasts and assumptions in the editable yellow cells (WACC, growth, margins).
- Step 4: Instantly see the recalculated results, including DTE Energy Company's (DTE) intrinsic value.
- Step 5: Make well-informed investment decisions or create reports based on the outputs.
Why Choose This Calculator for DTE Energy Company (DTE)?
- All-in-One Solution: Features DCF, WACC, and financial ratio assessments tailored for DTE.
- Flexible Inputs: Modify the yellow-highlighted fields to explore different financial scenarios.
- In-Depth Analysis: Automatically computes DTE’s intrinsic value and Net Present Value.
- Preloaded Information: Access historical and projected data for reliable analysis.
- High-Quality Standards: Perfect for financial analysts, investors, and business advisors focused on DTE.
Who Should Use This Product?
- Energy Students: Understand energy market dynamics and apply concepts using real-world data.
- Researchers: Utilize industry models for academic studies related to energy production and consumption.
- Investors: Evaluate your investment strategies and assess valuation metrics for DTE Energy Company (DTE).
- Financial Analysts: Enhance your analysis with a customizable financial model tailored for energy companies.
- Utility Managers: Discover best practices in analyzing large utility companies like DTE Energy Company (DTE).
What the Template Contains
- Preloaded DTE Data: Historical and projected financial information, including revenue, EBIT, and capital expenditures.
- DCF and WACC Models: Professional-grade sheets for determining intrinsic value and Weighted Average Cost of Capital.
- Editable Inputs: Yellow-highlighted cells for modifying revenue growth, tax rates, and discount rates.
- Financial Statements: Detailed annual and quarterly financials for in-depth analysis.
- Key Ratios: Profitability, leverage, and efficiency ratios for performance evaluation.
- Dashboard and Charts: Visual representations of valuation results and underlying assumptions.
Disclaimer
All information, articles, and product details provided on this website are for general informational and educational purposes only. We do not claim any ownership over, nor do we intend to infringe upon, any trademarks, copyrights, logos, brand names, or other intellectual property mentioned or depicted on this site. Such intellectual property remains the property of its respective owners, and any references here are made solely for identification or informational purposes, without implying any affiliation, endorsement, or partnership.
We make no representations or warranties, express or implied, regarding the accuracy, completeness, or suitability of any content or products presented. Nothing on this website should be construed as legal, tax, investment, financial, medical, or other professional advice. In addition, no part of this site—including articles or product references—constitutes a solicitation, recommendation, endorsement, advertisement, or offer to buy or sell any securities, franchises, or other financial instruments, particularly in jurisdictions where such activity would be unlawful.
All content is of a general nature and may not address the specific circumstances of any individual or entity. It is not a substitute for professional advice or services. Any actions you take based on the information provided here are strictly at your own risk. You accept full responsibility for any decisions or outcomes arising from your use of this website and agree to release us from any liability in connection with your use of, or reliance upon, the content or products found herein.