
|
Dynex Capital ، Inc. (DX) DCF تقييم |
Fully Editable: Tailor To Your Needs In Excel Or Sheets
Professional Design: Trusted, Industry-Standard Templates
Investor-Approved Valuation Models
MAC/PC Compatible, Fully Unlocked
No Expertise Is Needed; Easy To Follow
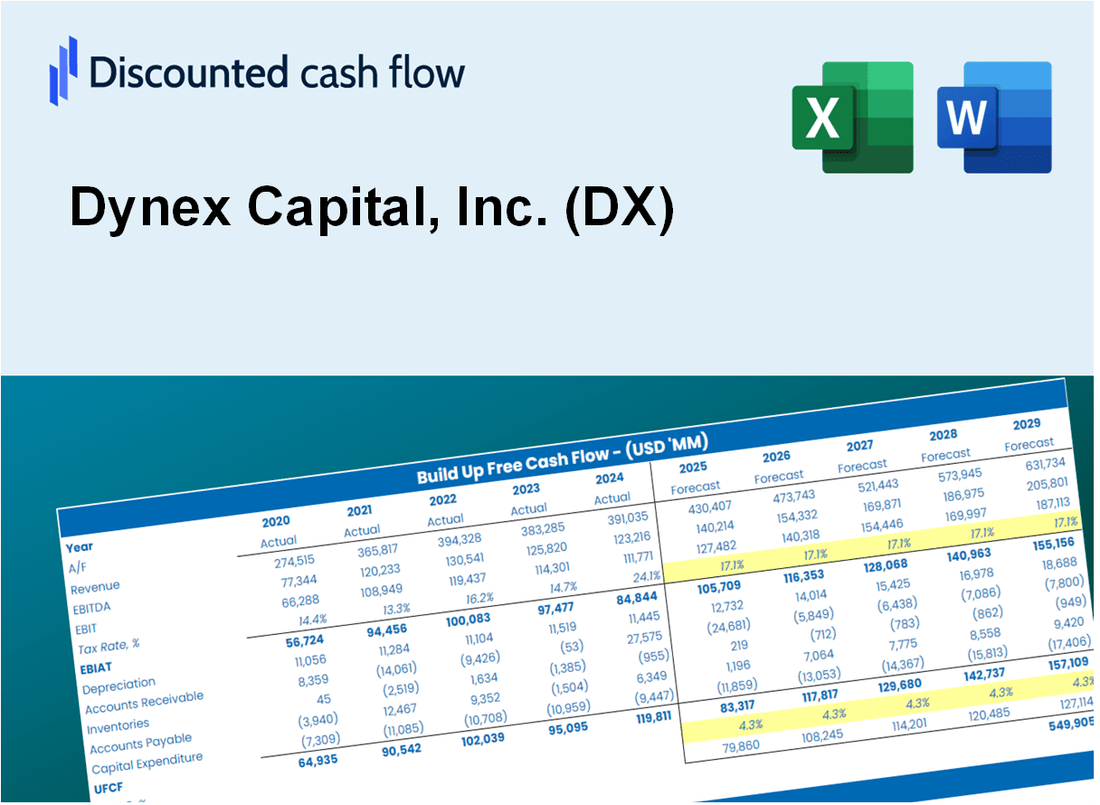
Dynex Capital, Inc. (DX) Bundle
تبسيط التقييم Dynex Capital ، Inc. (DX) مع هذه الآلة الحاسبة DCF القابلة للتخصيص! يتميز Dynex Capital ، Inc. (DX) ومدخلات التنبؤ القابلة للتعديل ، يمكنك اختبار السيناريوهات وكشف القيمة العادلة Dynex Capital ، Inc. (DX) في دقائق.
What You Will Get
- Pre-Filled Financial Model: Dynex Capital’s actual data enables precise DCF valuation.
- Full Forecast Control: Adjust revenue growth, margins, WACC, and other key drivers.
- Instant Calculations: Automatic updates ensure you see results as you make changes.
- Investor-Ready Template: A refined Excel file designed for professional-grade valuation.
- Customizable and Reusable: Tailored for flexibility, allowing repeated use for detailed forecasts.
Key Features
- Customizable Investment Parameters: Adjust essential inputs such as dividend yield, asset allocation, and interest rates.
- Instant DCF Valuation: Quickly computes intrinsic value, NPV, and other financial metrics.
- Industry-Leading Precision: Incorporates Dynex Capital’s actual financial data for accurate valuation results.
- Effortless Scenario Analysis: Easily evaluate various assumptions and analyze results side by side.
- Efficiency Booster: Avoid the complexity of developing intricate valuation models from the ground up.
How It Works
- 1. Access the Template: Download and open the Excel file featuring Dynex Capital, Inc.'s (DX) preloaded data.
- 2. Adjust Assumptions: Modify key inputs such as growth rates, WACC, and capital expenditures.
- 3. View Results Instantly: The DCF model automatically calculates intrinsic value and NPV in real-time.
- 4. Explore Scenarios: Analyze various forecasts to evaluate different valuation outcomes.
- 5. Present with Assurance: Deliver professional valuation insights to bolster your decision-making.
Why Choose Dynex Capital, Inc. (DX) Calculator?
- Save Time: No need to build a financial model from the ground up – it's ready for immediate use.
- Enhance Accuracy: Dependable financial data and calculations minimize valuation errors.
- Completely Customizable: Adjust the model to align with your specific assumptions and forecasts.
- User-Friendly: Intuitive charts and outputs simplify the analysis of results.
- Endorsed by Professionals: Crafted for experts who prioritize precision and functionality.
Who Should Use This Product?
- Institutional Investors: Develop comprehensive valuation models for assessing Dynex Capital, Inc. (DX) investments.
- Real Estate Analysts: Evaluate investment opportunities in the mortgage REIT sector to inform strategic decisions.
- Financial Advisors: Deliver precise valuation analyses to clients interested in Dynex Capital, Inc. (DX) stock.
- Academic Researchers: Utilize current market data for studies on real estate investment trusts and financial modeling.
- Market Enthusiasts: Gain insights into how companies like Dynex Capital, Inc. (DX) are valued within the financial markets.
What the Template Contains
- Historical Data: Includes Dynex Capital, Inc.'s (DX) past financials and baseline forecasts.
- DCF and Levered DCF Models: Detailed templates to calculate Dynex Capital, Inc.'s (DX) intrinsic value.
- WACC Sheet: Pre-built calculations for Weighted Average Cost of Capital.
- Editable Inputs: Modify key drivers like growth rates, dividend yields, and CAPEX assumptions.
- Quarterly and Annual Statements: A complete breakdown of Dynex Capital, Inc.'s (DX) financials.
- Interactive Dashboard: Visualize valuation results and projections dynamically.
Disclaimer
All information, articles, and product details provided on this website are for general informational and educational purposes only. We do not claim any ownership over, nor do we intend to infringe upon, any trademarks, copyrights, logos, brand names, or other intellectual property mentioned or depicted on this site. Such intellectual property remains the property of its respective owners, and any references here are made solely for identification or informational purposes, without implying any affiliation, endorsement, or partnership.
We make no representations or warranties, express or implied, regarding the accuracy, completeness, or suitability of any content or products presented. Nothing on this website should be construed as legal, tax, investment, financial, medical, or other professional advice. In addition, no part of this site—including articles or product references—constitutes a solicitation, recommendation, endorsement, advertisement, or offer to buy or sell any securities, franchises, or other financial instruments, particularly in jurisdictions where such activity would be unlawful.
All content is of a general nature and may not address the specific circumstances of any individual or entity. It is not a substitute for professional advice or services. Any actions you take based on the information provided here are strictly at your own risk. You accept full responsibility for any decisions or outcomes arising from your use of this website and agree to release us from any liability in connection with your use of, or reliance upon, the content or products found herein.