
|
DCF DCF ، Inc. (DXCM) DCF |
Fully Editable: Tailor To Your Needs In Excel Or Sheets
Professional Design: Trusted, Industry-Standard Templates
Investor-Approved Valuation Models
MAC/PC Compatible, Fully Unlocked
No Expertise Is Needed; Easy To Follow
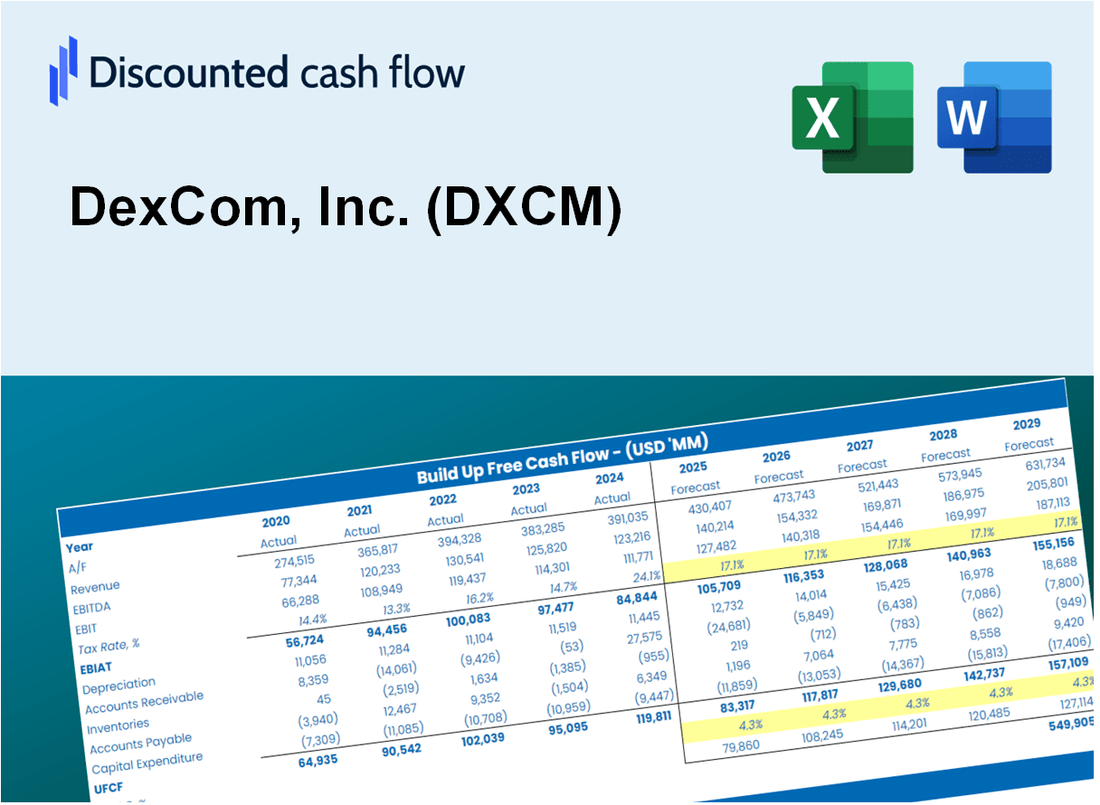
DexCom, Inc. (DXCM) Bundle
سواء كنت مستثمرًا أو محللًا ، فإن حاسبة DXCM DCF هذه هي مورد الخاص بك للتقييم الدقيق. محملة بالبيانات الحقيقية من Dexcom ، Inc. ، يمكنك ضبط التنبؤات ومراقبة التأثيرات في الوقت الفعلي.
Discounted Cash Flow (DCF) - (USD MM)
| Year | AY1 2020 |
AY2 2021 |
AY3 2022 |
AY4 2023 |
AY5 2024 |
FY1 2025 |
FY2 2026 |
FY3 2027 |
FY4 2028 |
FY5 2029 |
|---|---|---|---|---|---|---|---|---|---|---|
| Revenue | 1,926.7 | 2,448.5 | 2,909.8 | 3,622.3 | 4,033.0 | 4,857.2 | 5,849.9 | 7,045.4 | 8,485.2 | 10,219.4 |
| Revenue Growth, % | 0 | 27.08 | 18.84 | 24.49 | 11.34 | 20.44 | 20.44 | 20.44 | 20.44 | 20.44 |
| EBITDA | 376.8 | 377.5 | 565.3 | 916.7 | 945.7 | 1,002.1 | 1,206.9 | 1,453.6 | 1,750.6 | 2,108.4 |
| EBITDA, % | 19.56 | 15.42 | 19.43 | 25.31 | 23.45 | 20.63 | 20.63 | 20.63 | 20.63 | 20.63 |
| Depreciation | 67.1 | 101.9 | 155.9 | 186.0 | 217.7 | 228.6 | 275.4 | 331.6 | 399.4 | 481.0 |
| Depreciation, % | 3.48 | 4.16 | 5.36 | 5.13 | 5.4 | 4.71 | 4.71 | 4.71 | 4.71 | 4.71 |
| EBIT | 309.7 | 275.6 | 409.4 | 730.7 | 728.0 | 773.5 | 931.6 | 1,122.0 | 1,351.2 | 1,627.4 |
| EBIT, % | 16.07 | 11.26 | 14.07 | 20.17 | 18.05 | 15.92 | 15.92 | 15.92 | 15.92 | 15.92 |
| Total Cash | 2,707.7 | 2,731.2 | 2,456.2 | 2,724.1 | 2,579.4 | 4,114.8 | 4,955.7 | 5,968.5 | 7,188.2 | 8,657.3 |
| Total Cash, percent | .0 | .0 | .0 | .0 | .0 | .0 | .0 | .0 | .0 | .0 |
| Account Receivables | 428.5 | 516.6 | 752.2 | 987.5 | 1,033.6 | 1,185.9 | 1,428.3 | 1,720.2 | 2,071.7 | 2,495.1 |
| Account Receivables, % | 22.24 | 21.1 | 25.85 | 27.26 | 25.63 | 24.42 | 24.42 | 24.42 | 24.42 | 24.42 |
| Inventories | 234.7 | 357.3 | 306.7 | 559.6 | 542.6 | 643.3 | 774.7 | 933.1 | 1,123.7 | 1,353.4 |
| Inventories, % | 12.18 | 14.59 | 10.54 | 15.45 | 13.45 | 13.24 | 13.24 | 13.24 | 13.24 | 13.24 |
| Accounts Payable | 163.3 | 189.4 | 237.9 | 276.4 | 345.3 | 394.2 | 474.8 | 571.8 | 688.6 | 829.4 |
| Accounts Payable, % | 8.48 | 7.74 | 8.18 | 7.63 | 8.56 | 8.12 | 8.12 | 8.12 | 8.12 | 8.12 |
| Capital Expenditure | -199.0 | -389.2 | -364.8 | -236.6 | -358.8 | -526.4 | -634.0 | -763.6 | -919.6 | -1,107.6 |
| Capital Expenditure, % | -10.33 | -15.9 | -12.54 | -6.53 | -8.9 | -10.84 | -10.84 | -10.84 | -10.84 | -10.84 |
| Tax Rate, % | 18.73 | 18.73 | 18.73 | 18.73 | 18.73 | 18.73 | 18.73 | 18.73 | 18.73 | 18.73 |
| EBITAT | 679.4 | 232.8 | 357.4 | 557.0 | 591.6 | 664.1 | 799.8 | 963.2 | 1,160.1 | 1,397.2 |
| Depreciation | ||||||||||
| Changes in Account Receivables | ||||||||||
| Changes in Inventories | ||||||||||
| Changes in Accounts Payable | ||||||||||
| Capital Expenditure | ||||||||||
| UFCF | 47.6 | -239.1 | 12.0 | 56.7 | 490.3 | 162.2 | 147.9 | 178.1 | 214.5 | 258.3 |
| WACC, % | 10.23 | 10.18 | 10.19 | 10.15 | 10.16 | 10.18 | 10.18 | 10.18 | 10.18 | 10.18 |
| PV UFCF | ||||||||||
| SUM PV UFCF | 706.8 | |||||||||
| Long Term Growth Rate, % | 4.00 | |||||||||
| Free cash flow (T + 1) | 269 | |||||||||
| Terminal Value | 4,347 | |||||||||
| Present Terminal Value | 2,677 | |||||||||
| Enterprise Value | 3,384 | |||||||||
| Net Debt | 1,981 | |||||||||
| Equity Value | 1,402 | |||||||||
| Diluted Shares Outstanding, MM | 413 | |||||||||
| Equity Value Per Share | 3.40 |
What You Will Get
- Real DexCom Data: Preloaded financials – from revenue to EBIT – based on actual and projected figures.
- Full Customization: Adjust all critical parameters (yellow cells) like WACC, growth %, and tax rates.
- Instant Valuation Updates: Automatic recalculations to analyze the impact of changes on DexCom’s fair value.
- Versatile Excel Template: Tailored for quick edits, scenario testing, and detailed projections.
- Time-Saving and Accurate: Skip building models from scratch while maintaining precision and flexibility.
Key Features
- Comprehensive DCF Calculator: Offers detailed unlevered and levered DCF valuation models tailored for DexCom, Inc. (DXCM).
- WACC Calculator: Features a pre-built Weighted Average Cost of Capital sheet with customizable inputs specific to DexCom, Inc. (DXCM).
- Customizable Forecast Assumptions: Adjust growth rates, capital expenditures, and discount rates to fit DexCom, Inc. (DXCM) projections.
- Integrated Financial Ratios: Evaluate profitability, leverage, and efficiency ratios relevant to DexCom, Inc. (DXCM).
- Visual Dashboard and Charts: Provides visual outputs that summarize key valuation metrics for straightforward analysis of DexCom, Inc. (DXCM).
How It Works
- Step 1: Download the prebuilt Excel template featuring DexCom’s data included.
- Step 2: Review the pre-filled sheets to familiarize yourself with the key metrics.
- Step 3: Modify forecasts and assumptions in the editable yellow cells (WACC, growth, margins).
- Step 4: Instantly see recalculated results, including DexCom’s intrinsic value.
- Step 5: Make informed investment decisions or create reports based on the outputs.
Why Choose This Calculator for DexCom, Inc. (DXCM)?
- Comprehensive Tool: Features DCF, WACC, and financial ratio analyses all in one convenient package.
- Customizable Inputs: Modify the yellow-highlighted cells to explore different scenarios.
- Detailed Insights: Automatically computes DexCom’s intrinsic value and Net Present Value.
- Preloaded Data: Historical and projected data provide reliable starting points for analysis.
- Professional Quality: Perfect for financial analysts, investors, and business consultants.
Who Should Use This Product?
- Healthcare Investors: Make informed decisions with an advanced valuation tool tailored for biotech companies.
- Market Analysts: Streamline your analysis with a ready-to-use DCF model specifically designed for DexCom, Inc. (DXCM).
- Consultants: Effortlessly modify the template for client reports or presentations focused on diabetes management solutions.
- Health Tech Enthusiasts: Enhance your knowledge of valuation methods through practical, real-world applications.
- Educators and Students: Utilize it as a hands-on resource in courses related to healthcare finance.
What the Template Contains
- Pre-Filled DCF Model: DexCom’s financial data preloaded for immediate use.
- WACC Calculator: Detailed calculations for Weighted Average Cost of Capital.
- Financial Ratios: Evaluate DexCom’s profitability, leverage, and efficiency.
- Editable Inputs: Change assumptions such as growth, margins, and CAPEX to fit your scenarios.
- Financial Statements: Annual and quarterly reports to support detailed analysis.
- Interactive Dashboard: Easily visualize key valuation metrics and results.
Disclaimer
All information, articles, and product details provided on this website are for general informational and educational purposes only. We do not claim any ownership over, nor do we intend to infringe upon, any trademarks, copyrights, logos, brand names, or other intellectual property mentioned or depicted on this site. Such intellectual property remains the property of its respective owners, and any references here are made solely for identification or informational purposes, without implying any affiliation, endorsement, or partnership.
We make no representations or warranties, express or implied, regarding the accuracy, completeness, or suitability of any content or products presented. Nothing on this website should be construed as legal, tax, investment, financial, medical, or other professional advice. In addition, no part of this site—including articles or product references—constitutes a solicitation, recommendation, endorsement, advertisement, or offer to buy or sell any securities, franchises, or other financial instruments, particularly in jurisdictions where such activity would be unlawful.
All content is of a general nature and may not address the specific circumstances of any individual or entity. It is not a substitute for professional advice or services. Any actions you take based on the information provided here are strictly at your own risk. You accept full responsibility for any decisions or outcomes arising from your use of this website and agree to release us from any liability in connection with your use of, or reliance upon, the content or products found herein.