
|
Ehang Holdings Limited (EH) تقييم DCF |
Fully Editable: Tailor To Your Needs In Excel Or Sheets
Professional Design: Trusted, Industry-Standard Templates
Investor-Approved Valuation Models
MAC/PC Compatible, Fully Unlocked
No Expertise Is Needed; Easy To Follow
EHang Holdings Limited (EH) Bundle
تبحث لتحديد القيمة الجوهرية لـ Ehang Holdings Limited؟ يدمج حاسبة DCF الخاصة بنا (EH) DCF بيانات العالم الحقيقي بميزات تخصيص واسعة ، مما يتيح لك ضبط التوقعات وتعزيز استراتيجيات الاستثمار الخاصة بك.
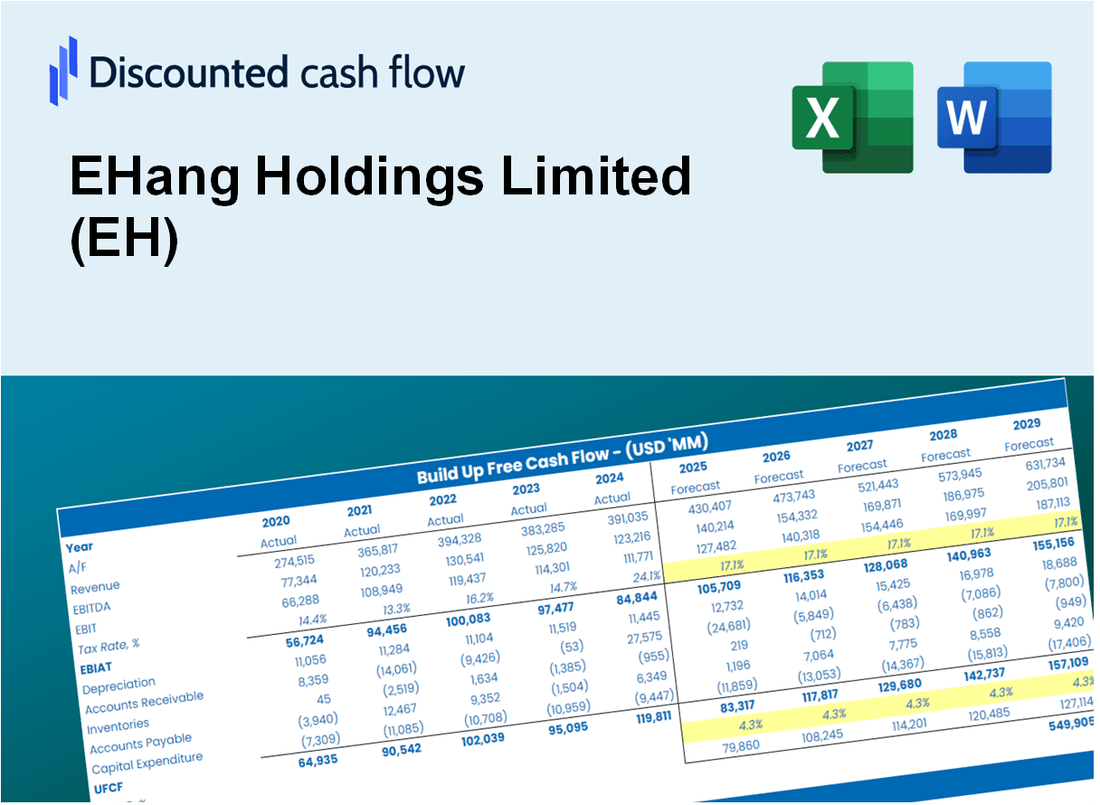
Discounted Cash Flow (DCF) - (USD MM)
| Year | AY1 2020 |
AY2 2021 |
AY3 2022 |
AY4 2023 |
AY5 2024 |
FY1 2025 |
FY2 2026 |
FY3 2027 |
FY4 2028 |
FY5 2029 |
|---|---|---|---|---|---|---|---|---|---|---|
| Revenue | 25.3 | 8.0 | 6.2 | 16.5 | 64.1 | 81.7 | 104.1 | 132.6 | 168.9 | 215.1 |
| Revenue Growth, % | 0 | -68.46 | -21.99 | 164.97 | 288.46 | 27.39 | 27.39 | 27.39 | 27.39 | 27.39 |
| EBITDA | -12.0 | -44.0 | -42.8 | -37.1 | -33.8 | -65.3 | -83.2 | -106.0 | -135.1 | -172.1 |
| EBITDA, % | -47.26 | -550.57 | -687.63 | -225.05 | -52.65 | -79.98 | -79.98 | -79.98 | -79.98 | -79.98 |
| Depreciation | .9 | 1.1 | 2.9 | 3.0 | 1.9 | 13.9 | 17.8 | 22.6 | 28.8 | 36.7 |
| Depreciation, % | 3.44 | 13.68 | 47.14 | 18.19 | 2.9 | 17.07 | 17.07 | 17.07 | 17.07 | 17.07 |
| EBIT | -12.8 | -45.1 | -45.8 | -40.2 | -35.6 | -66.4 | -84.5 | -107.7 | -137.2 | -174.8 |
| EBIT, % | -50.69 | -564.25 | -734.77 | -243.24 | -55.55 | -81.25 | -81.25 | -81.25 | -81.25 | -81.25 |
| Total Cash | 26.3 | 43.9 | 35.0 | 42.2 | 158.1 | 81.7 | 104.1 | 132.6 | 168.9 | 215.1 |
| Total Cash, percent | .0 | .0 | .0 | .0 | .0 | .0 | .0 | .0 | .0 | .0 |
| Account Receivables | 23.0 | 10.4 | 4.4 | 6.5 | 11.4 | 52.0 | 66.2 | 84.3 | 107.4 | 136.8 |
| Account Receivables, % | 90.99 | 130.33 | 70.17 | 39.15 | 17.73 | 63.61 | 63.61 | 63.61 | 63.61 | 63.61 |
| Inventories | 6.6 | 11.0 | 10.2 | 8.4 | 10.6 | 47.9 | 61.1 | 77.8 | 99.1 | 126.2 |
| Inventories, % | 26.15 | 137.44 | 163.29 | 50.66 | 16.59 | 58.68 | 58.68 | 58.68 | 58.68 | 58.68 |
| Accounts Payable | 8.5 | 6.4 | 5.0 | 4.9 | 17.9 | 41.1 | 52.4 | 66.7 | 85.0 | 108.2 |
| Accounts Payable, % | 33.54 | 80.2 | 80.01 | 29.89 | 27.94 | 50.32 | 50.32 | 50.32 | 50.32 | 50.32 |
| Capital Expenditure | -1.3 | -2.2 | -1.9 | -1.3 | -5.5 | -13.1 | -16.7 | -21.2 | -27.1 | -34.5 |
| Capital Expenditure, % | -5.04 | -27.63 | -31.18 | -7.74 | -8.54 | -16.03 | -16.03 | -16.03 | -16.03 | -16.03 |
| Tax Rate, % | -0.05660887 | -0.05660887 | -0.05660887 | -0.05660887 | -0.05660887 | -0.05660887 | -0.05660887 | -0.05660887 | -0.05660887 | -0.05660887 |
| EBITAT | -12.2 | -45.1 | -45.8 | -40.1 | -35.6 | -65.7 | -83.7 | -106.6 | -135.8 | -173.0 |
| Depreciation | ||||||||||
| Changes in Account Receivables | ||||||||||
| Changes in Inventories | ||||||||||
| Changes in Accounts Payable | ||||||||||
| Capital Expenditure | ||||||||||
| UFCF | -33.8 | -40.0 | -39.4 | -38.7 | -33.5 | -119.6 | -98.7 | -125.8 | -160.2 | -204.1 |
| WACC, % | 8.48 | 8.5 | 8.5 | 8.5 | 8.5 | 8.5 | 8.5 | 8.5 | 8.5 | 8.5 |
| PV UFCF | ||||||||||
| SUM PV UFCF | -543.9 | |||||||||
| Long Term Growth Rate, % | 2.00 | |||||||||
| Free cash flow (T + 1) | -208 | |||||||||
| Terminal Value | -3,203 | |||||||||
| Present Terminal Value | -2,131 | |||||||||
| Enterprise Value | -2,674 | |||||||||
| Net Debt | -53 | |||||||||
| Equity Value | -2,621 | |||||||||
| Diluted Shares Outstanding, MM | 17 | |||||||||
| Equity Value Per Share | -156.07 |
What You Will Receive
- Comprehensive Financial Model: EHang Holdings Limited's actual data facilitates accurate DCF valuation.
- Complete Forecast Flexibility: Modify revenue growth, profit margins, WACC, and other essential metrics.
- Real-Time Calculations: Instant updates allow you to view results as you make adjustments.
- Professional-Grade Template: A polished Excel file crafted for high-quality valuation presentations.
- Adaptable and Reusable: Designed for versatility, enabling repeated utilization for in-depth forecasts.
Key Features
- Comprehensive DCF Calculator: Features both unlevered and levered DCF valuation models tailored for EHang Holdings Limited (EH).
- WACC Calculation Tool: Comes with a pre-configured Weighted Average Cost of Capital sheet that allows for custom inputs.
- Customizable Forecast Inputs: Adjust growth rates, capital expenditures, and discount rates to fit your analysis.
- Integrated Financial Ratios: Evaluate profitability, leverage, and efficiency ratios specific to EHang Holdings Limited (EH).
- Interactive Dashboard and Visuals: Visual representations provide a summary of essential valuation metrics for straightforward analysis.
How It Works
- 1. Access the Template: Download and open the Excel file containing EHang Holdings Limited’s (EH) preloaded data.
- 2. Modify Assumptions: Adjust key variables such as growth rates, WACC, and capital expenditures.
- 3. View Results Immediately: The DCF model automatically calculates the intrinsic value and NPV.
- 4. Explore Scenarios: Analyze various forecasts to evaluate different valuation results.
- 5. Present with Assurance: Share professional valuation insights to enhance your decision-making process.
Why Choose the EHang Holdings Limited (EH) Calculator?
- Accuracy: Utilizes authentic EHang financial data to guarantee precision.
- Flexibility: Allows users to easily experiment and adjust inputs as needed.
- Time-Saving: Avoid the complexities of creating a DCF model from the ground up.
- Professional-Grade: Crafted with the expertise and usability expected at the CFO level.
- User-Friendly: Designed for simplicity, making it accessible for users without advanced financial modeling skills.
Who Should Use This Product?
- Professional Investors: Create in-depth and trustworthy valuation models for analyzing the portfolio of EHang Holdings Limited (EH).
- Corporate Finance Teams: Evaluate valuation scenarios to inform strategic decisions within the organization.
- Consultants and Advisors: Deliver precise valuation insights to clients regarding EHang Holdings Limited (EH).
- Students and Educators: Utilize real-world data to practice and teach financial modeling techniques.
- Aerospace Enthusiasts: Gain insights into how innovative companies like EHang Holdings Limited (EH) are valued in the market.
What the Template Contains
- Pre-Filled DCF Model: EHang Holdings Limited's (EH) financial data preloaded for immediate use.
- WACC Calculator: Detailed calculations for Weighted Average Cost of Capital.
- Financial Ratios: Evaluate EHang's (EH) profitability, leverage, and efficiency.
- Editable Inputs: Change assumptions such as growth, margins, and CAPEX to fit your scenarios.
- Financial Statements: Annual and quarterly reports to support detailed analysis.
- Interactive Dashboard: Easily visualize key valuation metrics and results.
Disclaimer
All information, articles, and product details provided on this website are for general informational and educational purposes only. We do not claim any ownership over, nor do we intend to infringe upon, any trademarks, copyrights, logos, brand names, or other intellectual property mentioned or depicted on this site. Such intellectual property remains the property of its respective owners, and any references here are made solely for identification or informational purposes, without implying any affiliation, endorsement, or partnership.
We make no representations or warranties, express or implied, regarding the accuracy, completeness, or suitability of any content or products presented. Nothing on this website should be construed as legal, tax, investment, financial, medical, or other professional advice. In addition, no part of this site—including articles or product references—constitutes a solicitation, recommendation, endorsement, advertisement, or offer to buy or sell any securities, franchises, or other financial instruments, particularly in jurisdictions where such activity would be unlawful.
All content is of a general nature and may not address the specific circumstances of any individual or entity. It is not a substitute for professional advice or services. Any actions you take based on the information provided here are strictly at your own risk. You accept full responsibility for any decisions or outcomes arising from your use of this website and agree to release us from any liability in connection with your use of, or reliance upon, the content or products found herein.