
|
Enbridge Inc. (ENB) تقييم DCF |
Fully Editable: Tailor To Your Needs In Excel Or Sheets
Professional Design: Trusted, Industry-Standard Templates
Investor-Approved Valuation Models
MAC/PC Compatible, Fully Unlocked
No Expertise Is Needed; Easy To Follow
Enbridge Inc. (ENB) Bundle
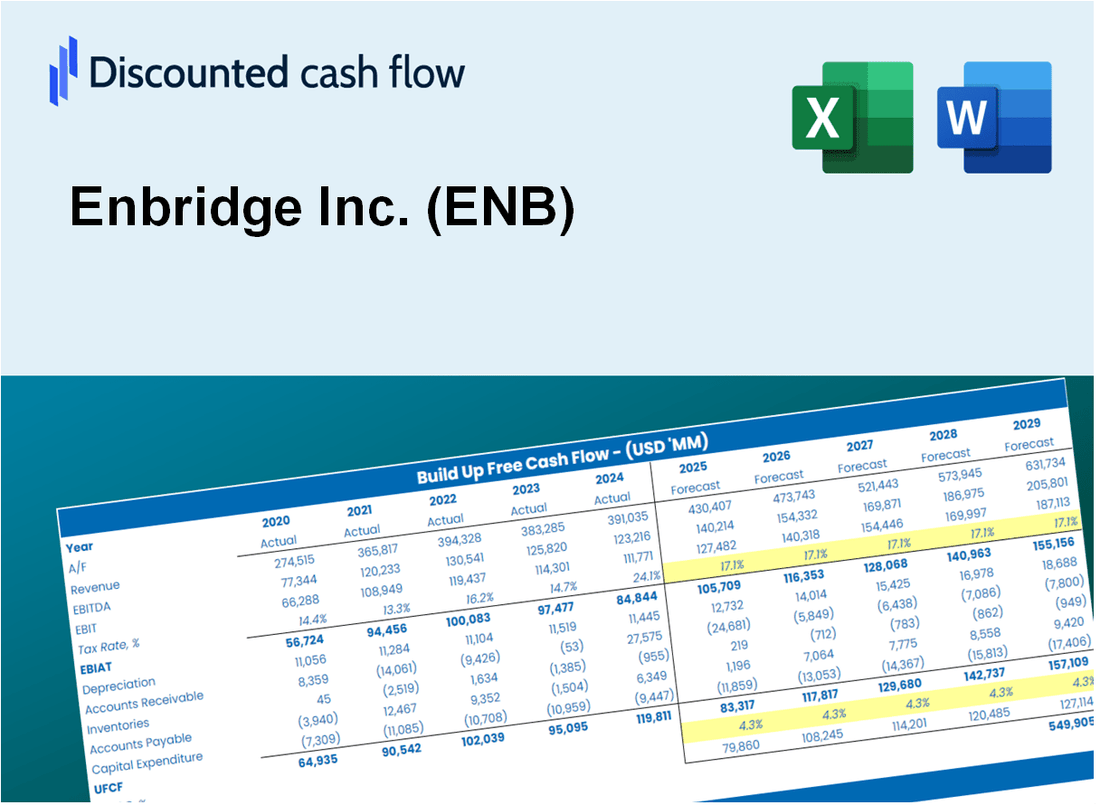
تم تصميم حاسبة DCF الخاصة بنا ، التي تم تصميمها من أجل الدقة ، من تقييم تقييم Enbridge Inc. باستخدام البيانات المالية في العالم الحقيقي ، مع تقديم مرونة كاملة لتعديل جميع المعلمات الأساسية للتوقعات المحسنة.
Discounted Cash Flow (DCF) - (USD MM)
| Year | AY1 2020 |
AY2 2021 |
AY3 2022 |
AY4 2023 |
AY5 2024 |
FY1 2025 |
FY2 2026 |
FY3 2027 |
FY4 2028 |
FY5 2029 |
|---|---|---|---|---|---|---|---|---|---|---|
| Revenue | 27,873.3 | 33,566.8 | 38,015.1 | 31,126.5 | 38,132.1 | 41,760.8 | 45,734.8 | 50,087.0 | 54,853.4 | 60,073.3 |
| Revenue Growth, % | 0 | 20.43 | 13.25 | -18.12 | 22.51 | 9.52 | 9.52 | 9.52 | 9.52 | 9.52 |
| EBITDA | 7,663.1 | 10,187.5 | 8,616.5 | 11,658.6 | 12,028.0 | 12,487.1 | 13,675.3 | 14,976.7 | 16,401.9 | 17,962.8 |
| EBITDA, % | 27.49 | 30.35 | 22.67 | 37.46 | 31.54 | 29.9 | 29.9 | 29.9 | 29.9 | 29.9 |
| Depreciation | 2,647.1 | 2,746.9 | 3,078.5 | 3,289.6 | 3,684.6 | 3,842.8 | 4,208.5 | 4,608.9 | 5,047.5 | 5,527.9 |
| Depreciation, % | 9.5 | 8.18 | 8.1 | 10.57 | 9.66 | 9.2 | 9.2 | 9.2 | 9.2 | 9.2 |
| EBIT | 5,016.0 | 7,440.6 | 5,538.0 | 8,369.0 | 8,343.4 | 8,644.3 | 9,466.9 | 10,367.8 | 11,354.4 | 12,434.9 |
| EBIT, % | 18 | 22.17 | 14.57 | 26.89 | 21.88 | 20.7 | 20.7 | 20.7 | 20.7 | 20.7 |
| Total Cash | 322.3 | 203.9 | 614.0 | 4,208.1 | 1,285.7 | 1,693.0 | 1,854.1 | 2,030.5 | 2,223.8 | 2,435.4 |
| Total Cash, percent | .0 | .0 | .0 | .0 | .0 | .0 | .0 | .0 | .0 | .0 |
| Account Receivables | 2,844.6 | 3,901.4 | 4,316.4 | 3,452.9 | 5,266.3 | 4,851.5 | 5,313.2 | 5,818.8 | 6,372.5 | 6,978.9 |
| Account Receivables, % | 10.21 | 11.62 | 11.35 | 11.09 | 13.81 | 11.62 | 11.62 | 11.62 | 11.62 | 11.62 |
| Inventories | 1,095.3 | 1,190.9 | 1,608.1 | 1,054.7 | 1,061.1 | 1,493.3 | 1,635.4 | 1,791.0 | 1,961.4 | 2,148.1 |
| Inventories, % | 3.93 | 3.55 | 4.23 | 3.39 | 2.78 | 3.58 | 3.58 | 3.58 | 3.58 | 3.58 |
| Accounts Payable | 2,509.4 | 3,187.6 | 4,401.3 | 3,072.1 | 5,034.6 | 4,439.1 | 4,861.6 | 5,324.2 | 5,830.9 | 6,385.7 |
| Accounts Payable, % | 9 | 9.5 | 11.58 | 9.87 | 13.2 | 10.63 | 10.63 | 10.63 | 10.63 | 10.63 |
| Capital Expenditure | -4,007.7 | -5,771.2 | -3,437.9 | -3,477.1 | -4,941.8 | -5,407.7 | -5,922.3 | -6,485.8 | -7,103.0 | -7,779.0 |
| Capital Expenditure, % | -14.38 | -17.19 | -9.04 | -11.17 | -12.96 | -12.95 | -12.95 | -12.95 | -12.95 | -12.95 |
| Tax Rate, % | 25.46 | 25.46 | 25.46 | 25.46 | 25.46 | 25.46 | 25.46 | 25.46 | 25.46 | 25.46 |
| EBITAT | 4,026.0 | 5,958.0 | 3,661.5 | 6,576.1 | 6,219.5 | 6,562.3 | 7,186.8 | 7,870.7 | 8,619.7 | 9,439.9 |
| Depreciation | ||||||||||
| Changes in Account Receivables | ||||||||||
| Changes in Inventories | ||||||||||
| Changes in Accounts Payable | ||||||||||
| Capital Expenditure | ||||||||||
| UFCF | 1,234.9 | 2,459.5 | 3,683.6 | 6,476.2 | 5,104.9 | 4,384.7 | 5,291.6 | 5,795.2 | 6,346.7 | 6,950.6 |
| WACC, % | 5.91 | 5.91 | 5.66 | 5.88 | 5.81 | 5.83 | 5.83 | 5.83 | 5.83 | 5.83 |
| PV UFCF | ||||||||||
| SUM PV UFCF | 24,050.4 | |||||||||
| Long Term Growth Rate, % | 2.00 | |||||||||
| Free cash flow (T + 1) | 7,090 | |||||||||
| Terminal Value | 184,973 | |||||||||
| Present Terminal Value | 139,318 | |||||||||
| Enterprise Value | 163,369 | |||||||||
| Net Debt | 71,217 | |||||||||
| Equity Value | 92,151 | |||||||||
| Diluted Shares Outstanding, MM | 2,158 | |||||||||
| Equity Value Per Share | 42.70 |
What You Will Get
- Editable Forecast Inputs: Easily modify assumptions (growth %, margins, WACC) to explore various scenarios.
- Real-World Data: Enbridge Inc.'s (ENB) financial data pre-filled to kickstart your analysis.
- Automatic DCF Outputs: The template computes Net Present Value (NPV) and intrinsic value for you.
- Customizable and Professional: A sleek Excel model that adjusts to your valuation requirements.
- Built for Analysts and Investors: Perfect for evaluating projections, confirming strategies, and enhancing efficiency.
Key Features
- Comprehensive Data: Enbridge’s historical financial statements and pre-filled forecasts.
- Customizable Inputs: Modify WACC, tax rates, revenue growth, and EBITDA margins as needed.
- Real-Time Insights: Watch Enbridge’s intrinsic value update instantly.
- Visual Performance Metrics: Dashboard charts illustrate valuation results and essential metrics.
- Designed for Precision: A professional-grade tool for analysts, investors, and finance professionals.
How It Works
- Step 1: Download the Excel file.
- Step 2: Review Enbridge Inc.'s (ENB) pre-filled financial data and forecasts.
- Step 3: Modify critical inputs like revenue growth, WACC, and tax rates (highlighted cells).
- Step 4: Watch the DCF model update instantly as you tweak assumptions.
- Step 5: Analyze the outputs and use the results for investment decisions.
Why Choose This Calculator for Enbridge Inc. (ENB)?
- Accurate Data: Utilize real Enbridge financials for dependable valuation outcomes.
- Customizable: Modify essential parameters such as growth rates, WACC, and tax rates to align with your forecasts.
- Time-Saving: Pre-configured calculations streamline the process, eliminating the need to start from scratch.
- Professional-Grade Tool: Tailored for investors, analysts, and consultants in the energy sector.
- User-Friendly: An intuitive design and clear instructions make it accessible for all users.
Who Should Use Enbridge Inc. (ENB)?
- Investors: Gain insights into energy sector investments with a reliable analysis tool.
- Financial Analysts: Streamline your evaluations with a comprehensive model tailored for Enbridge Inc. (ENB).
- Consultants: Effortlessly modify the framework for client strategies or presentations focused on Enbridge Inc. (ENB).
- Energy Enthusiasts: Enhance your knowledge of the energy market through practical case studies.
- Educators and Students: Utilize it as a hands-on resource in energy finance and investment courses.
What the Template Contains
- Pre-Filled DCF Model: Enbridge Inc.’s (ENB) financial data preloaded for immediate use.
- WACC Calculator: Detailed calculations for Weighted Average Cost of Capital.
- Financial Ratios: Evaluate Enbridge Inc.’s (ENB) profitability, leverage, and efficiency.
- Editable Inputs: Change assumptions such as growth, margins, and CAPEX to fit your scenarios.
- Financial Statements: Annual and quarterly reports to support detailed analysis.
- Interactive Dashboard: Easily visualize key valuation metrics and results.
Disclaimer
All information, articles, and product details provided on this website are for general informational and educational purposes only. We do not claim any ownership over, nor do we intend to infringe upon, any trademarks, copyrights, logos, brand names, or other intellectual property mentioned or depicted on this site. Such intellectual property remains the property of its respective owners, and any references here are made solely for identification or informational purposes, without implying any affiliation, endorsement, or partnership.
We make no representations or warranties, express or implied, regarding the accuracy, completeness, or suitability of any content or products presented. Nothing on this website should be construed as legal, tax, investment, financial, medical, or other professional advice. In addition, no part of this site—including articles or product references—constitutes a solicitation, recommendation, endorsement, advertisement, or offer to buy or sell any securities, franchises, or other financial instruments, particularly in jurisdictions where such activity would be unlawful.
All content is of a general nature and may not address the specific circumstances of any individual or entity. It is not a substitute for professional advice or services. Any actions you take based on the information provided here are strictly at your own risk. You accept full responsibility for any decisions or outcomes arising from your use of this website and agree to release us from any liability in connection with your use of, or reliance upon, the content or products found herein.