
|
Enlivex Therapeutics Ltd. (ENLV) تقييم DCF |
Fully Editable: Tailor To Your Needs In Excel Or Sheets
Professional Design: Trusted, Industry-Standard Templates
Investor-Approved Valuation Models
MAC/PC Compatible, Fully Unlocked
No Expertise Is Needed; Easy To Follow
Enlivex Therapeutics Ltd. (ENLV) Bundle
تقييم التوقعات المالية Enlivex Therapeutics Ltd. (ENLV) مثل خبير! توفر لك حاسبة DCF (ENLV) هذه البيانات المالية المليئة مسبقًا وحرية تعديل نمو الإيرادات و WACC والهوامش والافتراضات الأساسية الأخرى التي تتماشى مع تنبؤاتك.
What You Will Get
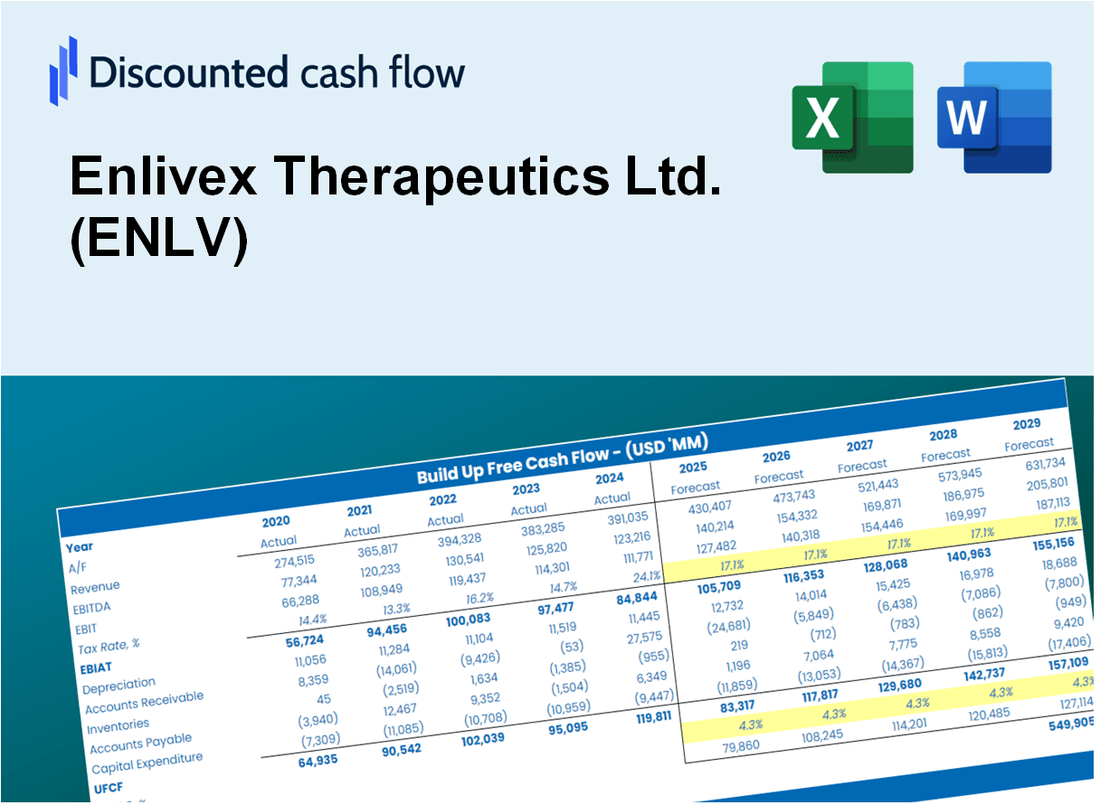
- Real Enlivex Data: Preloaded financials – from revenue to EBIT – based on actual and projected figures for Enlivex Therapeutics Ltd. (ENLV).
- Full Customization: Adjust all critical parameters (yellow cells) like WACC, growth %, and tax rates to fit your analysis.
- Instant Valuation Updates: Automatic recalculations to analyze the impact of changes on Enlivex’s fair value.
- Versatile Excel Template: Designed for quick edits, scenario testing, and detailed projections specific to Enlivex Therapeutics Ltd. (ENLV).
- Time-Saving and Accurate: Skip building models from scratch while ensuring precision and flexibility in your financial analysis.
Key Features
- Comprehensive DCF Model: Features both unlevered and levered DCF valuation frameworks tailored for Enlivex Therapeutics Ltd. (ENLV).
- WACC Analysis Tool: Pre-configured Weighted Average Cost of Capital template with adjustable parameters.
- Customizable Forecast Inputs: Adjust growth projections, capital investments, and discount rates as needed.
- Integrated Financial Metrics: Evaluate profitability, debt levels, and operational efficiency ratios specific to Enlivex Therapeutics Ltd. (ENLV).
- Interactive Dashboard and Visuals: Graphical representations provide a clear overview of essential valuation indicators for straightforward assessment.
How It Works
- Step 1: Download the prebuilt Excel template featuring Enlivex Therapeutics Ltd. (ENLV) data.
- Step 2: Navigate through the pre-filled sheets to grasp the essential metrics.
- Step 3: Modify forecasts and assumptions in the editable yellow cells (WACC, growth, margins).
- Step 4: Instantly see the recalculated results, including Enlivex's intrinsic value.
- Step 5: Make well-informed investment decisions or create reports utilizing the outputs.
Why Choose This Calculator?
- User-Friendly Interface: Perfect for both novice users and seasoned professionals.
- Customizable Variables: Easily adjust inputs to tailor your financial analysis.
- Real-Time Feedback: Observe immediate changes to Enlivex Therapeutics’ valuation as you modify inputs.
- Preconfigured Data: Comes with Enlivex’s actual financial metrics for swift evaluations.
- Relied Upon by Experts: Utilized by investors and analysts to guide their strategic decisions.
Who Should Use This Product?
- Investors: Accurately estimate Enlivex Therapeutics Ltd.'s (ENLV) fair value before making investment decisions.
- CFOs: Leverage a professional-grade DCF model for financial reporting and analysis specific to Enlivex Therapeutics Ltd. (ENLV).
- Consultants: Quickly adapt the template for valuation reports tailored to Enlivex Therapeutics Ltd. (ENLV) for clients.
- Entrepreneurs: Gain insights into financial modeling practices used by leading biotech firms like Enlivex Therapeutics Ltd. (ENLV).
- Educators: Use it as a teaching tool to demonstrate valuation methodologies relevant to the biotech industry, including Enlivex Therapeutics Ltd. (ENLV).
What the Template Contains
- Pre-Filled DCF Model: Enlivex Therapeutics Ltd.'s (ENLV) financial data preloaded for immediate use.
- WACC Calculator: Detailed calculations for Weighted Average Cost of Capital.
- Financial Ratios: Evaluate Enlivex’s profitability, leverage, and efficiency.
- Editable Inputs: Change assumptions such as growth, margins, and CAPEX to fit your scenarios.
- Financial Statements: Annual and quarterly reports to support detailed analysis.
- Interactive Dashboard: Easily visualize key valuation metrics and results.
Disclaimer
All information, articles, and product details provided on this website are for general informational and educational purposes only. We do not claim any ownership over, nor do we intend to infringe upon, any trademarks, copyrights, logos, brand names, or other intellectual property mentioned or depicted on this site. Such intellectual property remains the property of its respective owners, and any references here are made solely for identification or informational purposes, without implying any affiliation, endorsement, or partnership.
We make no representations or warranties, express or implied, regarding the accuracy, completeness, or suitability of any content or products presented. Nothing on this website should be construed as legal, tax, investment, financial, medical, or other professional advice. In addition, no part of this site—including articles or product references—constitutes a solicitation, recommendation, endorsement, advertisement, or offer to buy or sell any securities, franchises, or other financial instruments, particularly in jurisdictions where such activity would be unlawful.
All content is of a general nature and may not address the specific circumstances of any individual or entity. It is not a substitute for professional advice or services. Any actions you take based on the information provided here are strictly at your own risk. You accept full responsibility for any decisions or outcomes arising from your use of this website and agree to release us from any liability in connection with your use of, or reliance upon, the content or products found herein.